| Weekly Outlook in the Stock Market |
| By Price Headley |
Published
09/17/2007
|
Stocks
|
Unrated
|
|
|
|
Weekly Outlook in the Stock Market
NASDAQ Composite
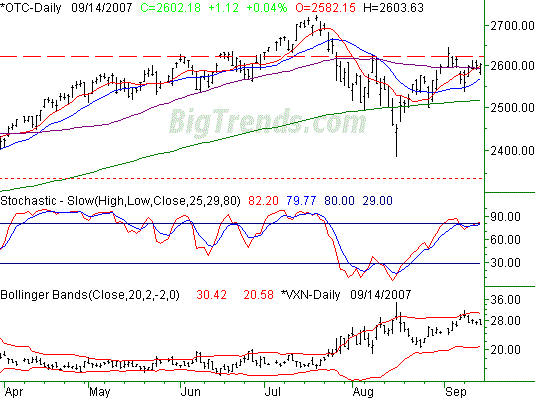
Though it was in the red for most of the day on Friday, the NASDAQ Composite basically closed at a break-even. On a weekly basis, the NASDAQ added 36.48 points, or 1.42%, but that actually trailed the S&P 500's and Dow's gains. Even so, that was enough to get the composite above the 10- and 50-day lines - the last two problem areas. So were bullish now? Not quite, we've seen this before, to no avail.
We'll devote most of our time today to the S&P 500 and the Dow, but we did want to mention our resistance line for the NASDAQ at 2621. A couple of closes above there would clear all the hurdles. The problem is, we're now stochastically overbought again. That's not an automatic problem, but can weigh in when things are a little shaky to begin with.
That said, take a look at the VXN. It's still coming down from a recent peak of 31.75. This suggests more bullishness ahead, especially considering the lower band is at 20.70, which means there's a lot of room for the VXN to slide lower.
NASDAQ Composite - Daily

S&P 500
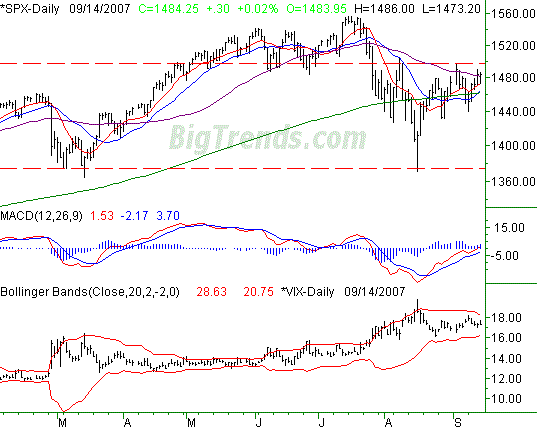
The S&P 500 also barely made it into the black on Friday, but it was still enough to get the large cap index over the 50-day line. In fact, we saw the 10-day average line also pay a support role over the last three days of the week. Though many of these chart factors are bullish hints, we're not quite there yet.
Just look at the SPX over the last three weeks; it's pointed higher following the reversal bar from the 16. But, it also hasn't been challenged yet. Like we discussed above, the 50-day line seems to be a sore spot. However, we're also going to add in the 1497 level as resistance. We topped there twice in the last couple of months, so only a close above that line would really mean anything bullish to us.
On the flipside, the 10-day line (red) at 1473 seems to be holding things up here. At this point, the 200-day line as well as the 20-day line (green and blue) are both at 1462. Let's use that as our ultimate support level.
As for the bigger picture, the MACD lines are already bullish. Now we're on the verge of seeing them move above the zero level. That's one of our more obscure but equally powerful bullish signs.
S&P 500 - Daily

Dow Jones Industrial Average
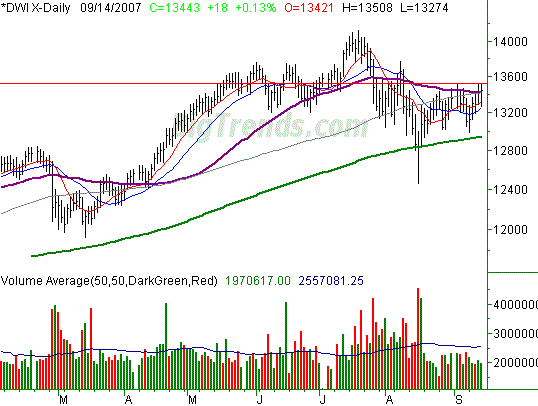
On Friday, the Dow Jones Industrial Average managed to squeeze out an 18 point (+0.13%) gain. For the week though, it closed 2.52% higher (up 330 points), mostly thanks to Tuesday and Thursday. The final push got the blue chip index above the 50 day average, and we're now seeing support from the 10- and 20-day lines. Though not in great shape yet, this is a step in the right direction for the bulls.
One thing you'll see a lot of right now on the Dow's chart is congestion. Most of the major moving averages are bunched up between 13,260 and 13,420. This is a testament to how back-and-forth things have been lately. But, it's also a sign of a big straight-line move brewing. Periods of high volatility and followed by periods of low volatility. The current chart is comparable to late March, when things started to look better right as many were starting to doubt the recovery effort. Though it's still not certain if the Dow will come out of this bullishly or bearishly, we do expect some bigger trends to be set into motion, particularly if the resistance lines are broken.
So what exactly are we looking for? A break past the recent ceiling of 13,521 would be bullish, as it would by default get the index above the 50-day average (purple). On the other side of the chart, we'd be concerned about a dip under the 20-day line (blue) at 13,261. But, only a close under the 200-day line (green) at 12,945 would really convert us to bears.
Dow Jones Industrial Average - Daily

Bottom Line
We know Monday's weak open isn't fully consistent with our modesty-bullish slant comments. But, the day isn't over yet, and one day doesn't make or break a trend. This is also expiration week, so look for things to get or stay choppy as the week goes on.
Price Headley is the founder and chief analyst of BigTrends.com.
|