| Corcoran Technical Trading Patterns for September 18 |
| By Clive Corcoran |
Published
09/18/2007
|
Stocks
|
Unrated
|
|
|
|
Corcoran Technical Trading Patterns for September 18
Later this afternoon we will find out the piece of information that traders have been focused on for the last few weeks. Ever since the asset-backed commercial paper and inter-bank market seized up in early August, there has been endless debate about the need for a major signal from the Federal Reserve that a credit crunch will not precipitate a significant downturn in economic activity. The ease in the discount rate by fifty basis points was seen as a partial acknowledgement of the gravity of the situation, but calls for reducing the Fed funds rate by a similar amount have been persistent ever since.
The markets spent most of yesterday biding their time before the announcement and there were a plethora of inside day and tiny intraday range patterns especially among the banks and stocks in the financial services.
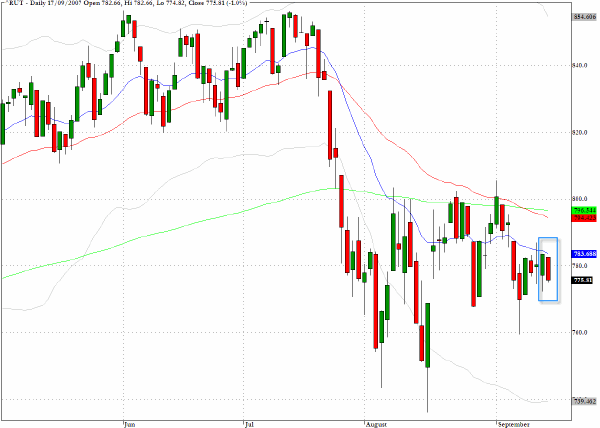
The Russell 2000 (^RUT) has effectively been in suspended animation for several sessions and I'll be watching this index keenly over the next few sessions as a way of assessing the market’s perception of the implications of the Fed’s move in regard to the broader economy. As discussed on many recent occasions, the index faces a formidable challenge at the 800 level, and if the bulls can penetrate that level convincingly in coming days then the previous mid-July highs would appear to be back in play. While that possibility certainly cannot be ruled out there is a strong possibility that the market gets what it wants - a fifty point easing - and then has to live with the fact that the problems in the financial economy involve more complex structural issues than can be addressed with a relatively blunt instrument such as the Fed funds rate.
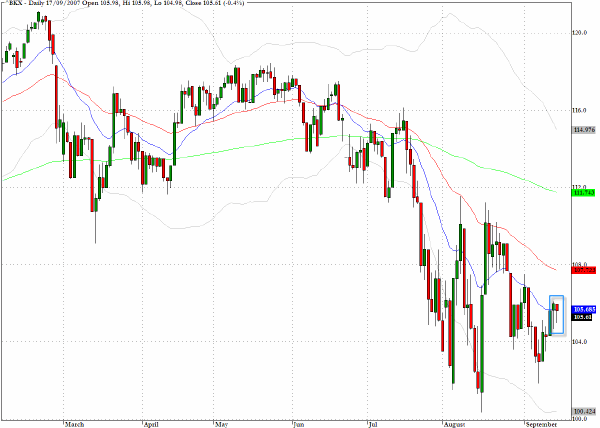
Another index which has moved into the apex of a distinct triangular formation is that of the banking sector (^BKX). As with the Russell 2000, this index faces a real hurdle at its 200-day EMA level, but as it has further to go to take on this hurdle; it faces resistance at the 50-day EMA level in the vicinity of 108 as well.
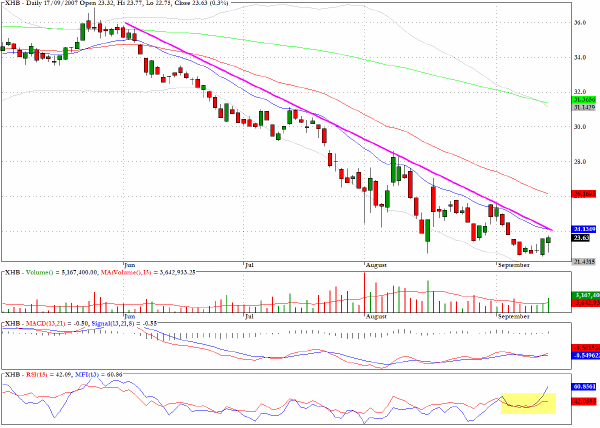
Could it be that the market has digested all of the negatives for the homebuilding sector? The chart for the ETF for the sector, XHB, shows the relentless decline over the course of the last few months in which the sector has followed the 20-day EMA all the way down. But there are some positive divergences emerging in the MACD and MFI charts, and it may be that the recognition that the FOMC is officially "worried about" a slowdown is the news that could create some buying and short covering in the sector.
TRADE OPPORTUNITIES/SETUPS FOR TUESDAY SEPTEMBER 18, 2007
The patterns identified below should be considered as indicative of eventual price direction in forthcoming trading sessions. None of these setups should be seen as specifically opportune for the current trading session.
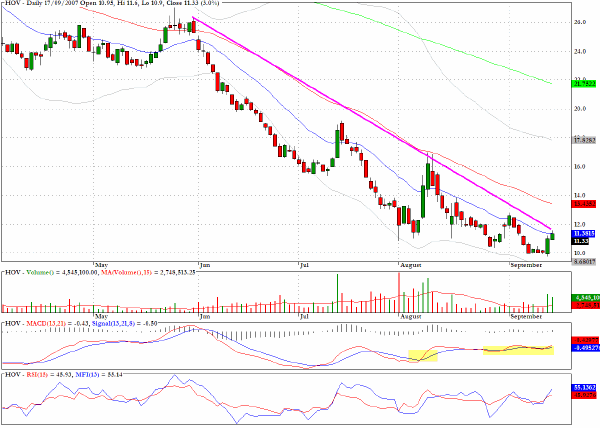
The chart for Hovnanian (HOV) echoes the comments made for the homebuilding sector in general. The stock appears to have been sold down to levels where the risk/reward ratio favors some kind of bounce.
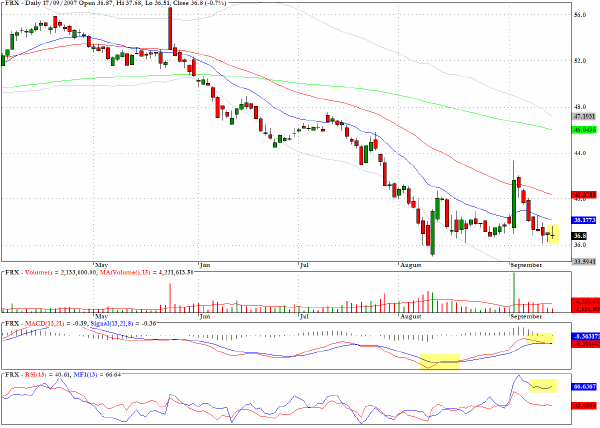
The chart for Forest Labs (FRX) has characteristics of a basing pattern with a pullback from an early September attempt to rally that may have run its course.
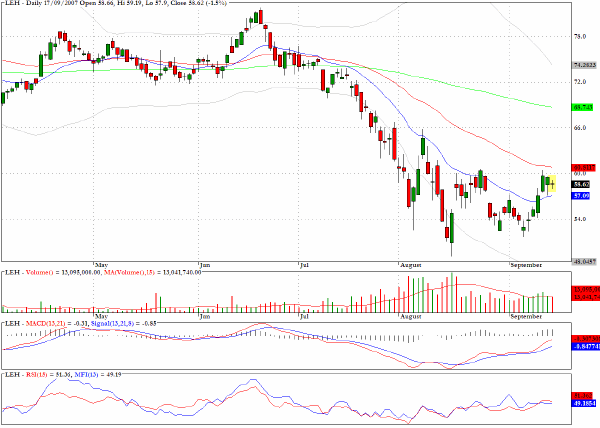
Lehman Brothers (LEH) appears to have broken above the descending trendline that follows the 20-day EMA (blue line on the chart).
Clive Corcoran is the publisher of TradeWithForm.com, which provides daily analysis and commentary on the US stock market. He specializes in market neutral investing and and is currently working on a book about the benefits of trading with long/short strategies, which is scheduled for publication later this year.
Disclaimer
The purpose of this article is to offer you the chance to review the trading methodology, risk reduction strategies and portfolio construction techniques described at tradewithform.com. There is no guarantee that the trading strategies advocated will be profitable. Moreover, there is a risk that following these strategies will lead to loss of capital. Past results are no guarantee of future results. Trading stocks and CFD's can yield large rewards, but also has large potential risks. Trading with leverage can be especially risky. You should be fully aware of the risks of trading in the capital markets. You are strongly advised not to trade with capital.
|