| Corcoran Technical Trading Patterns for September 20 |
| By Clive Corcoran |
Published
09/20/2007
|
Stocks
|
Unrated
|
|
|
|
Corcoran Technical Trading Patterns for September 20
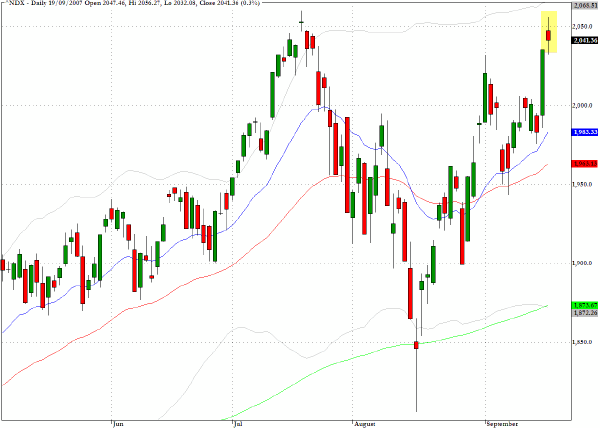
Many charts from yesterday reveal extended upper tails or shooting star candlesticks suggesting that the powerful rally that began Tuesday afternoon appears to have encountered its first layer of resistance. In the case of several key charts this is occurring at levels close to the mid July highs. In particular, the chart below for the Nasdaq 100 index (^NDX) indicates that moving above the 2050 level may require a period of re-grouping and consolidation.
In terms of the overall market, after two strong upward sessions some "profit taking" is likely, and the European action this morning is suggesting that the jubilation from Tuesday’s FOMC decision may have found its zenith in yesterday’s trading.
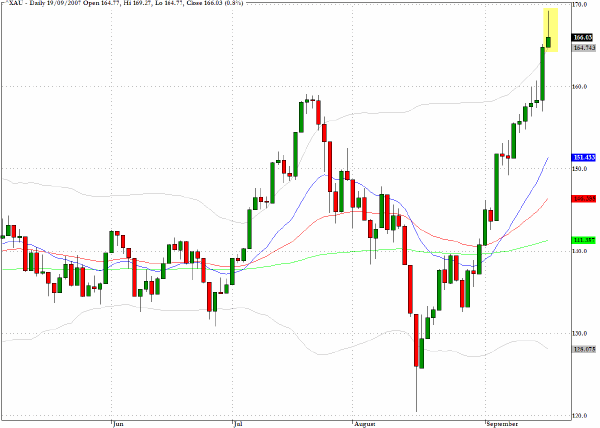
As discussed recently, the gold and silver index (^XAU) has made a dramatic V-shaped recovery since mid August. The index which is weighted towards the gold mining stocks has now pushed substantially above the mid-July high water mark but yesterday’s long upper tail could be pointing to the need for some digestion of the gains and a period of consolidation. In addition the precious metal is close to the levels from May 2006 and may also be ready for a period of retrenchment.
A breakout above the $730 level on the metal is a possibility but traders need to be vigilant regarding the possibility of a "false" breakout that could trap some players for both the mining stocks and the COMEX futures.
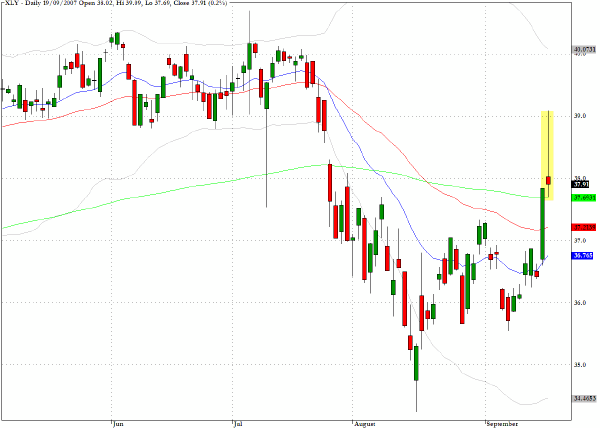
The exchange traded sector fund, XLY, which consists of consumer discretionary stocks clearly found the going tough as it tried to move away from the 200 day EMA. The close was at the bottom of the daily range and still in close proximity to the long term moving average.
TRADE OPPORTUNITIES/SETUPS FOR THURSDAY SEPTEMBER 20, 2007
The patterns identified below should be considered as indicative of eventual price direction in forthcoming trading sessions. None of these setups should be seen as specifically opportune for the current trading session.
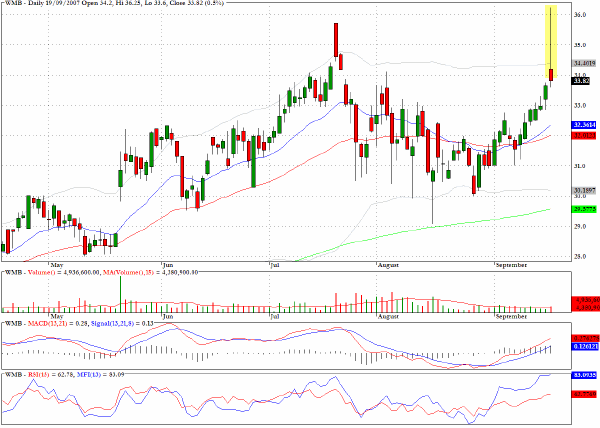
Williams Companies (WMB) which is engaged in the natural gas industry reveals a very striking shooting star formation. Although the intraday high broke above the previous mid July high the close was below the highest close from the earlier period. This is not a pattern that I would feel confident in taking up a short position just yet, but the stock will be on my watch list in coming sessions for further signs that a tradable correction could be imminent.
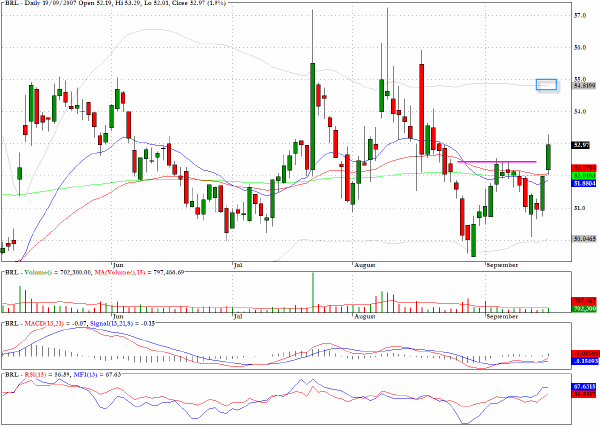
One pattern that looks promising on the long side is for Barr Pharmaceuticals (BRL) and I would be targeting the $55 level as the stock broke away from all three moving averages yesterday.
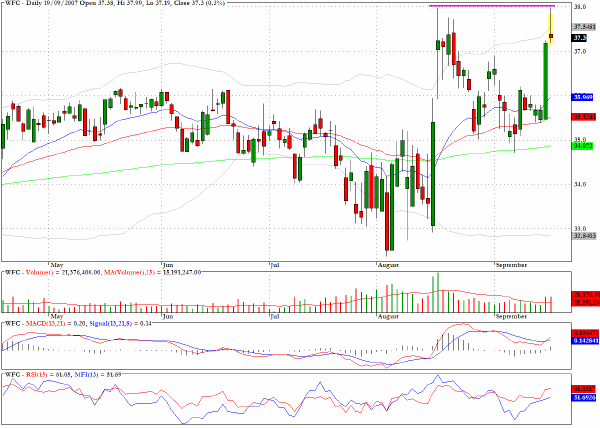
The chart for Wells Fargo (WFC) again reveals the shooting star formation with the intraday high turning back at the $38 level, which also coincides with the recovery high from mid-August when the banks lead the way out of the febrile market conditions that prevailed just one month ago.
Clive Corcoran is the publisher of TradeWithForm.com, which provides daily analysis and commentary on the US stock market. He specializes in market neutral investing and and is currently working on a book about the benefits of trading with long/short strategies, which is scheduled for publication later this year.
Disclaimer
The purpose of this article is to offer you the chance to review the trading methodology, risk reduction strategies and portfolio construction techniques described at tradewithform.com. There is no guarantee that the trading strategies advocated will be profitable. Moreover, there is a risk that following these strategies will lead to loss of capital. Past results are no guarantee of future results. Trading stocks and CFD's can yield large rewards, but also has large potential risks. Trading with leverage can be especially risky. You should be fully aware of the risks of trading in the capital markets. You are strongly advised not to trade with capital.
|