NASDAQ COMMENTARY
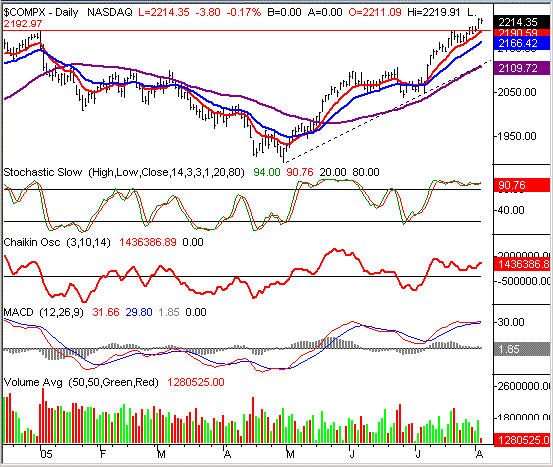
Much like Rocky, the NASDAQ refuses to go down - even when it probably should. At the end of last week, it really looked like the hot streak would come to an end, as the NASDAQ was meeting resistance at its previous high of 2192. The composite had actually gone as high as 2201, but the fact that it couldn't muster a decent close above that resistance was a signal (to us, anyway) that a lot of traders were just waiting for that mark to be reached before taking profits. Not quite, as it turns out. The NASDAQ surged to 2219 yesterday, blowing past all those problem levels.
Is it a bullish omen? There's no denying that the market has been defying the odds by moving higher. We thought stocks would finally get a breather after a short consolidation period two weeks ago. Instead, they just kept rolling - especially the NASDAQ (which will be the point of a key distinction below). Will August bring more of the same bullishness? It's not clear how the month will turn out, but from here, we still see a bearish problem. The CBOE Volatility Indexes (VXN and VIX) are both coming up off of extreme lows. That's a classic sign of a short-term downside move.
The composite, though, still shows no hint of complying. Even today, after some selling, the bulls are fighting back to get into positive territory. And the rallies aren't superficial. Yesterday's bullish volume was pretty high - high enough to prevent the Chaikin line from falling under zero. You'll recall that the Chaikin signal was the one we wanted to see that would really push us over to the bearish side of things. Well, we never saw it. In fact we see the opposite - the Chaikin line is rising again.
From here, it's tough to say what's next. We're still bullish in the bigger picture. But, even though the short-term momentum is to the upside, we anticipate a moderate correction in the very near future. The rally has been unchecked thus far, and a lot of folks are starting to assume again that the market is infallible. That's typically when it's the most vulnerable, so we're still cautious. We're planning on a dip soon, which could bring the NASDAQ closer to the 2140 level. It will be a healthy shake-out though. Note that the NASDAQ's strength is considerably greater than the other two major indexes.
NASDAQ CHART - Daily

S&P 500 COMMENTARY
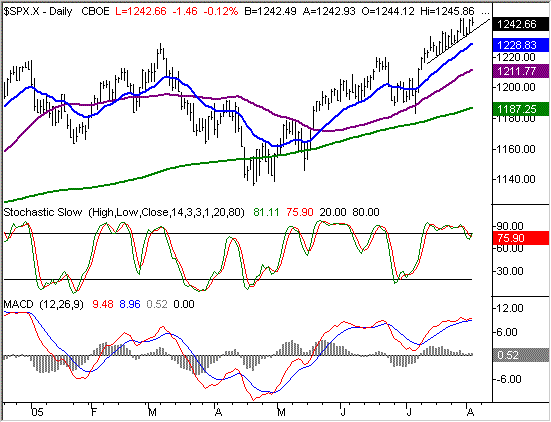
The support line that was guiding the S&P 500 higher is still, well, guiding it higher. It's currently at 1236.40 and rising, and is still going to be our first clue of any potential breakdown. But so far, any selling has been quickly met with even more buying, as the SPX hit another new 52-week high today (1245.86).
Some of the sell signals we thought we might see never materialized. One was a bearish MACD crossover, but that was avoided a couple of days ago, and we're actually seeing a bullish divergence again. We actually got a stochastic sell signal for the S&P 500 on the 2nd, but that's been undone by today's strength.
But still, like the NASDAQ, it's concerning to see stocks stay this bullish for this long without even a hint of weakness. As such, we expect to see it soon. One of the key comparisons we're making to the current SPX chart is the chart from two months ago - it looks very similar. That rally started with a big bang (on May 17th and 18th), then the market walked higher - at a slower pace - for about a month. A big chunk of that gain was retraced on June 23rd and 24th. On July 8th and 11th, we saw another huge two-day rally, and since then, the market has gained at a slower pace? A repeat of that chart? Possibly - the market does indeed tend to move in familiar patterns, so we are on the lookout for a similar scenario. If it does pan out that way, the S&P 500 could lose about 20 points. That would leave the index at 1220, or right between the 20 and 50 day averages. That's the same support level we mentioned last week.
The question is, will it matter? Stocks just won't quit, or so it seems. Our take here is still a bearish one though.....just a little. There's healthy bullishness, then there's unhealthy bullishness. With the VIX at all-time lows, and a rally that's been completely untested, we'd say we're seeing the unhealthy kind of bullishness. A correction is still in order, but not a big one. Like we said, the 1220 area is where to watch. In the meantime, keep an eye on the short-term support line to actually signal any downturn....because stocks are still in an uptrend.
S&P 500 CHART - DAILY

Price Headley is the founder and chief analyst of BigTrends.com.