| The McMillan Options Strategist Weekly |
| By Lawrence G. McMillan |
Published
09/21/2007
|
Options
|
Unrated
|
|
|
|
The McMillan Options Strategist Weekly
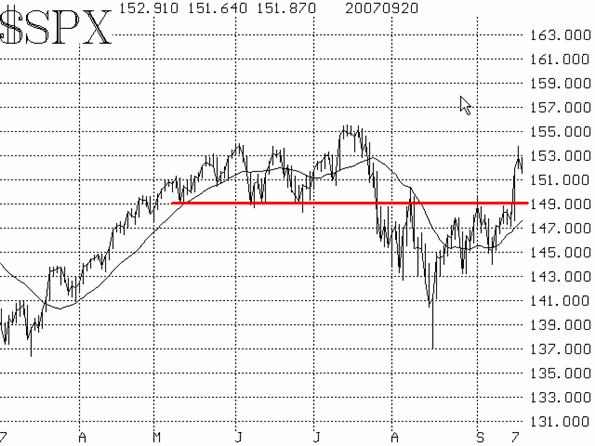
Thanks to Mr. Bernanke, the stock market broke out of its trading range on the upside. This breakout was accompanied by positive readings from our technical indicators, so we are inclined to say that a new leg to the bull market has begun.
As always, we'll rely on the technicals and not on our suspicions, to evaluate the current situation. Tuesday's massive rally pushed most indices to new relative highs -- if not new all-time highs. These rallies overcame resistance on most of the charts, and that is why it's considered to be an upside breakout. Specifically, $SPX broke out over the 1490 resistance level and also exceeded the 1505 closing high of August. Those areas now become support, and any pullbacks should find support there or higher. It is normal for there to be a pullback towards a support area after an upside breakout, and that's what's taking place now. Thus, Thursday's decline -- despite exhortations from bears that the market is overbought and is due for a tumble -- is just a minor pullback. If it finds support at or above the 1490 level on $SPX, the bull case will be intact.

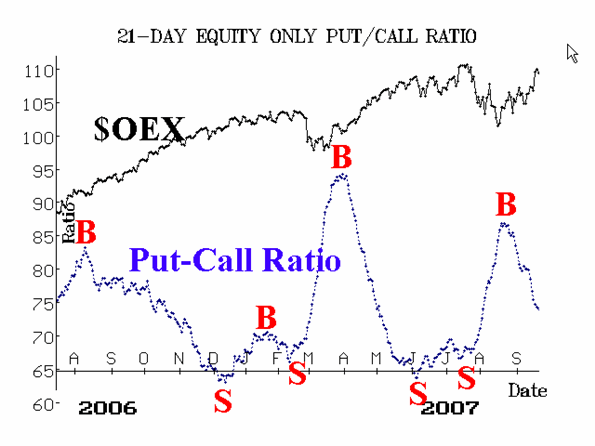
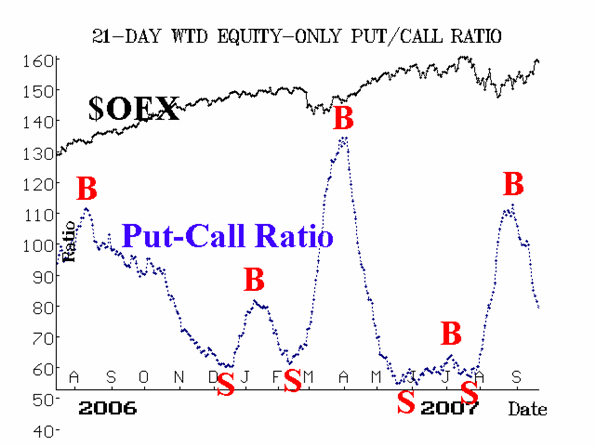
The equity-only put-call ratios are bullish. They gave buy signals a few weeks ago and have remained bullish ever since. They will retain that bullish status as long as the lines are declining on their charts (Figures 2 and 3), and that seems likely to continue for a while.


Market breadth (advances minus declines) reacted very positively to the upside move this week, as you might expect. As a result, breadth quickly reached overbought territory. This is something that is to be expected on the first leg of a new bull market, overbought readings.
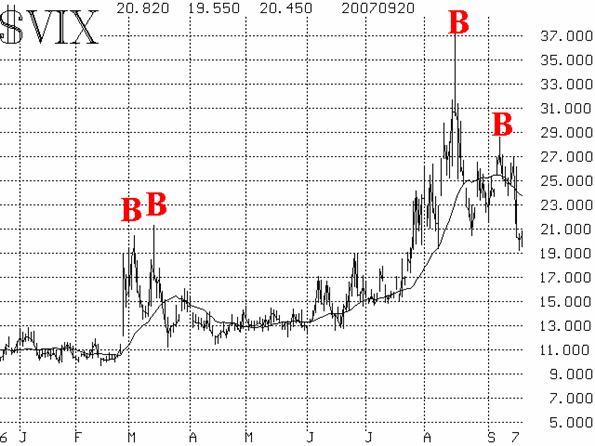
Finally, the volatility indices ($VIX and $VXO) collapsed with the rally Tuesday. Part of this collapse was due in any case, as $VIX was very inflated going into the Fed action and would have thus declined somewhat no matter where the market went on Tuesday. But the fact that $VIX broke down to near the 20 level, coupled with the fact that the 20-day moving average of $VIX is finally declining once again, are positive signs that place $VIX on a buy signal. That could be negated only if $VIX started to rise again. However, Thursday's decline of 10 $SPX points only pushed $VIX higher by 42 cents, so $VIX is retaining a bullish pattern at this time. Note that there have now been two $VIX buy signals since August (Figure 4) and there are usually two such signals before the market moves strongly higher (the most recent example being last March).

In summary, this breakout appears to be the real thing. There will be naysayers, of course, and the month of October is not often friendly to bull markets, but as long as $SPX continues to close above the 1490 level, the bulls are in charge.
Lawrence G. McMillan is the author of two best selling books on options, including Options as a Strategic Investment, recognized as essential resources for any serious option trader's library.
|