NASDAQ COMMENTARY
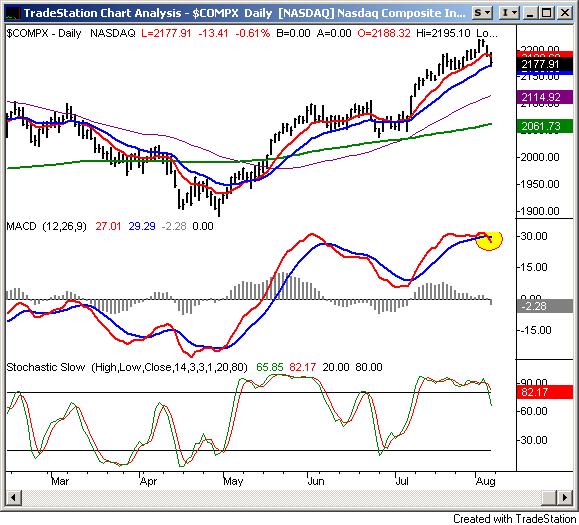
Time to pay the piper? Maybe - at least to a small degree. The NASDAQ Composite lost 39 points over Thursday and Friday, to end the week at 2177.91. That's the worst two-day period for the index we've seen since mid-June, and the technical damage inflicted was more than minor. Now that it's been made clear that the rally was able to be broken, the buyers shouldn't be quite as confident. In fact, we think the buyers will be mostly kept away for a few days, as the sellers stay in control - now that they have it.
That said, what we've seen over the last month is resiliency, so don't look for things to go straight down. Investors have been quick to buy on any weakness, so we may see a slight pushback early in the week. But like we said, we expect to see this downtrend drag the index down a little more. Unless the buying effort is strong enough to get the NASDAQ above the new 52-week high of 2219.91 (from Wednesday) - which is unlikely - we're planning on seeing the NASDAQ fall as low as 2215, or that area. That's about where the 50 day average is now, and it would be about a 5 percent drop from the recent peak, which is actually about the average size of a normal correction.
All the bearish signals are in place, or at least close to it. We have a bearish MACD crossover (highlighted in yellow), and a close under the 10 day average. There seems to be a little support at the 20 day line at 2170, which is why we mentioned there could be a little bit of a buy-in in the coming week. However, the NASDAQ is the only major index still trading above its 20 day average, and we expect it to break that support eventually like the other indexes already have. We're also on the verge of a full stochastic sell signal. It's only partially complete now. When the second line - the %D line in red - falls under the 80 threshold, that will be a fully bearish signal too.
NASDAQ COMPOSITE CHART - Daily

S&P 500 COMMENTARY
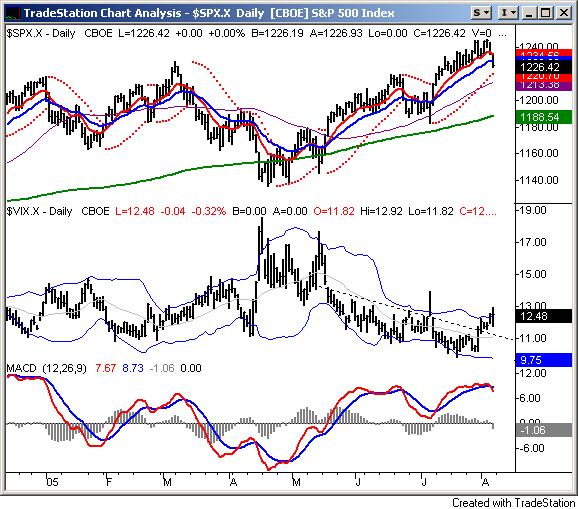
As troubled as the NASDAQ looks right now, the S&P 500 is in even more trouble, from a technical perspective. The SPX closed at 1226.42 on Friday, under its 10 day line. That's a sell signal, and is reinforced by a bearish MACD cross on this chart too. And more than that, the 10 day line appeared to be a resistance point on Friday.
As for a potential landing spot for this dip, the 50 day line is again a great place to start. It's currently at 1213, or about 143 points away. The problem with that potential move is that it's only about 3 percent off of the recent high of 1245.86. To really shake-out all of the dead weight and wishy-washy traders, we'd like to see a drop of about 5 percent here. Just think of it as a mini-capitulation. A three percent dip may not hurt all that much, but a five percent drop would instill some healthy skepticism. That's when bull trends start....and resume. So where would a five percent drop take us? To 1183.50. For reference, the 200 day line is at 1188 (green). Normally we'd worry about falling under the 200 day line, but when it happened in April, it wasn't a problem, and we don't think it would be a problem this time either. Our absolute support level, then, is 1183.
The distinguishing factor that makes this pullback a little more bearish than others, though, is the behavior of the VIX. After nearly three months of a downtrend, we're finally seeing it break out of those lines and work its way into new territory. In fact, you can see that resistance line (dashed) has been broken as of last week. One could make the case that the VIX will hit resistance at the upper band (as it already is) and get forced lower from here like it did in April. But this time, there are two major differences. First, in April, the VIX spiked to 18 in two days. This time around, the VIX is trending smoothly.....higher. Second, in April, the market had gone from bad to worse, and a bottom was due. Now, the market has given us three months of gains, and there are plenty of profits to be taken.
S&P 500 CHART - Daily

BOTTOM LINE
The only caveat to our now-bearish expectation is that the market has been resilient all year long - even when it shouldn't have been. While nowhere near as bad as it was in 1999, the euphoria is driving the market more than the underlying company performance is. That's a dangerous situation, which is why we actually would rather see a pullback soon....just to adjust attitudes. Our outlook will be negated only if we actually make new 52-week highs again. That could spark even more buying, which of course would be bullish, but unhealthy. In the bigger picture, we remain bullish either way, and see any dip as a chance to buy longer-term holdings. In the shorter-term, we see some bearish swing trades in the making.
Price Headley is the founder and chief analyst of BigTrends.com.