| Weekly Outlook in the Stock Market |
| By Price Headley |
Published
09/24/2007
|
Stocks
|
Unrated
|
|
|
|
Weekly Outlook in the Stock Market
NASDAQ Composite
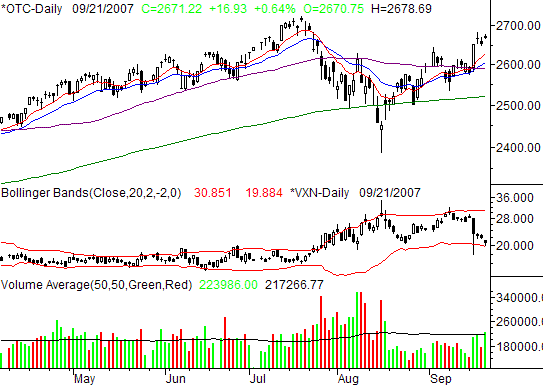
On Friday, the NASDAQ Composite rallied 16.93 points to end the day at 2671.22. That was a 0.64% gain for the day, and a 2.65% gain for the week (+69.04 points). This was the most bullish week we've seen in weeks, and we're starting to see the index really make a bullish divergence above all of its key moving average lines.
Since August - with the pullback - all of the key moving averages have been clogged up pretty tightly between 2500 and 2600. We believe this period of low volatility (and following a pretty good-sized correction) was essentially a regrouping for the market. Out of this consolidation period we have to assume the market will follow up with a major move, one way or the other. As of last week, it looks like the bulls have taken the lead.
The problem at this point is the VXN. It's back to the lower band, where the VXN has usually found support right as the market was making a top. Of course, it was a triple-witching expiration, so who knows whether this is a true picture of investor sentiment or not?
The other problem? The odds. September is historically the worst, a loser on average, yet we're now up. Granted, we had a blow-out about a month ago, and we can't live by the calendar. However, this definitely disrupts the usual October-through-December rally; we usually have to start at a pretty good bottom.
So, we'll tentatively assume the trend is going to stay in place, so we're leaning with the bulls for now. Keep an eye out for 2724.74, the July peak. A move past that mark would be new highs, and a bullish event. As for the downside, look for support at the 20-day line (at 2606). The final line in the sand is the 50-day line (at 2590).
NASDAQ Composite Chart

S&P 500 Commentary
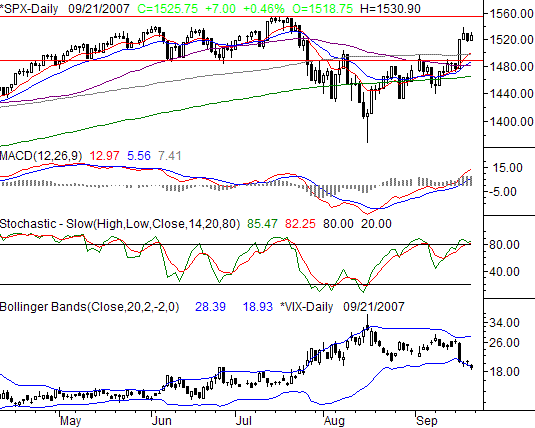
The S&P 500 closed out at 1525.75 on Friday, up 0.46%, or 7 points. For the week, the index gained 2.8%, or 41.5 points. The move put the SPX within striking distance (30 points) of new multi-year highs, and developed some nice upside momentum.
Check out the MACD lines - back above zero, and still showing a divergence. That's bullish, but we're also stochastically overbought again. More than that, the VIX is pressing into its lower band at 18.70.
Overall, we have to side with the momentum and assume more upside is in store. As with the NASDAQ though, be cautious about that. Last week's expiration not only skewed the VIX and VXN, but also pressured the market. In fact, the analysis is about the same, a move past the recent high of 1555 would be bullish, even if against the odds. A slide back under 1499 (let's call it 1500) would likely be a problem. That's where the 10- and 100-day lines are right now. On the other hand, we'd be willing to give the SPX leeway all the way to the 200-day average (1464). After all, all the key moving averages are all entangled right now, and are probably working together....as support, as well as a springboard.
S&P 500 Chart

Dow Jones Industrial Average Commentary
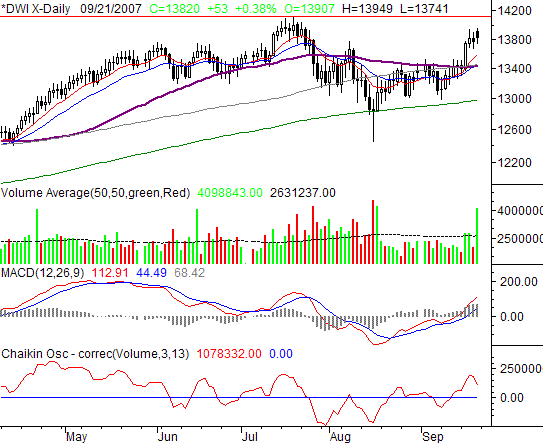
The Dow Jones Industrial Average gained 53 points on Friday (+0.38%) to end the session at 13,820. That was 377 points above the prior week's close (+2.8%), and the farthest we've been above the 50-day moving average line in weeks.
Everything we said about the S&P 500 and the NASDAQ? Ditto for the Dow. We're bullish based on the recent momentum...and cautious. The short-term checkpoint for the bulls is 14,121, while we should see support around 13,425. There's not a lot else we can say about the Dow, or would want to. Expiration really took a toll on the market's true conviction.
Dow Jones Industrial Average Chart

Bottom Line
We know there wasn't much to this week's analysis. We intend to say more in this coming week's MidWeek Update, once we see how things take shape early on in the coming week. Let's see if the bulls are still as bullish. Till then, sit tight.
Price Headley is the founder and chief analyst of BigTrends.com.
|