| Corcoran Technical Trading Patterns for September 25 |
| By Clive Corcoran |
Published
09/25/2007
|
Stocks
|
Unrated
|
|
|
|
Corcoran Technical Trading Patterns for September 25
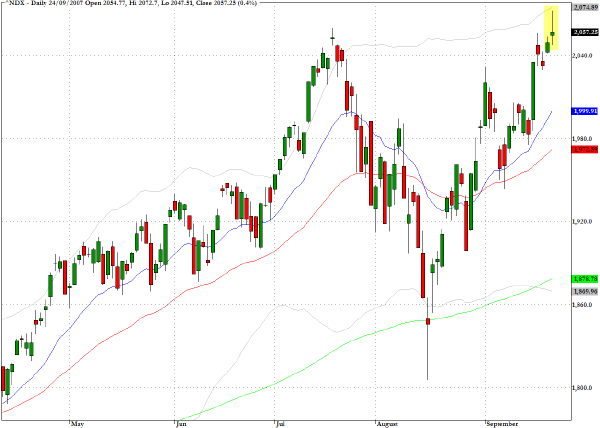
There were some notable divergences in the performance of the major equity indices in yesterday’s trading. The DJIA slipped back 0.4% and the S&P 500 retreated by 0.5% whereas the Nasdaq 100 index (^NDX) managed to gain 0.4% and close at a multi-year high just above the 2050 level.
The spinning top formation at a significant high, which also coincides with the upper volatility band, is an intriguing pattern that is sometimes indicative of a market inflection point. I still would expect the S&P 500 to rally back to the mid July highs around 1555 and to that extent the large Nasdaq stocks, which are currently favored by asset managers, should have further uplift potential. Just how much longevity this rally still has should become clearer as the DJIA and S&P 500 take on their mid July highs and if the charts reveal more spinning tops and shooting star patterns then we might be in for a lively start to trading conditions in October.
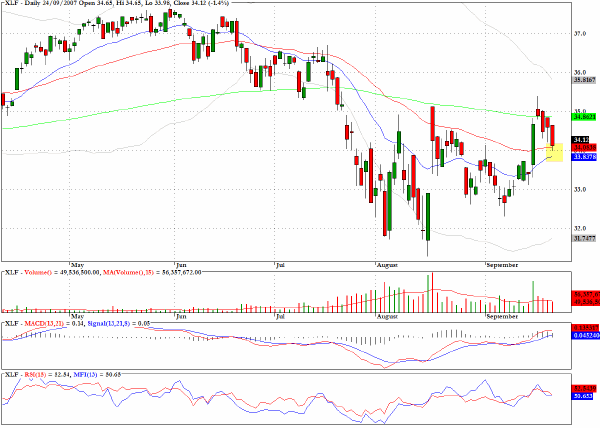
Some of the weaker stocks yesterday were found in the financial sector with the banking index (^BKX) dropping 1.6% and the broker/dealer index (^XBD) suffering a more than two percent decline. The exchange traded fund for the financial services sector, XLF has reached an intersection of the 20- and 50-day EMA’s and the pullback pattern since last Tuesday’s surge suggests that, if the bulls are still in control of the agenda, we should see a resumption in upward momentum in the near term.
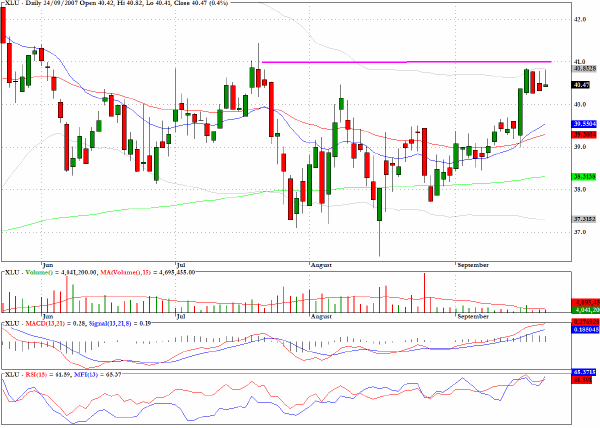
The pattern on the sector fund for the utilities, XLU, looks constructive on the long side in the intermediate term and I would be targeting the $42 level which was achieved in mid May.
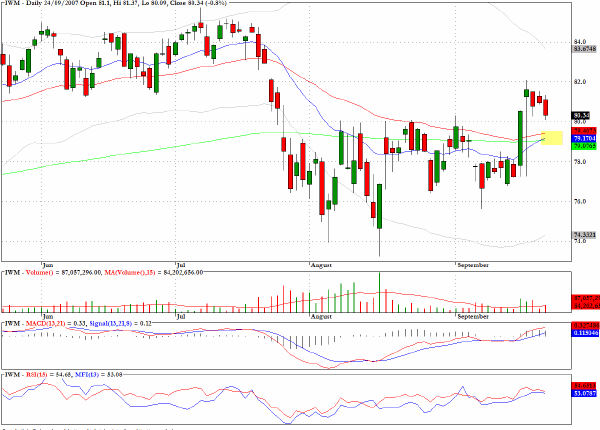
The bullish reaction to the fed funds easing last week should play well for the small cap Russell 2000 index which dropped back towards the 800 level in yesterday’s trading. I would expect a bounce in the cash index at this level and the easiest way to play this would be via the exchange traded proxy, IWM.
TRADE OPPORTUNITIES/SETUPS FOR TUESDAY SEPTEMBER 25, 2007
The patterns identified below should be considered as indicative of eventual price direction in forthcoming trading sessions. None of these setups should be seen as specifically opportune for the current trading session.
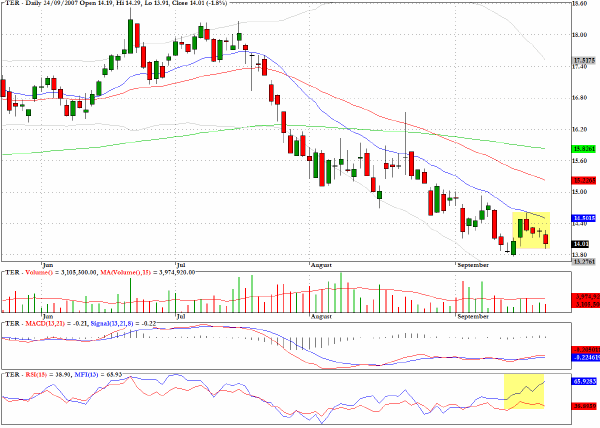
There is a notable positive divergence on the chart for Teradyne (TER) between price action over the last few sessions and the upward slant to the MFI. This is a pattern which can produce explosive breakouts.
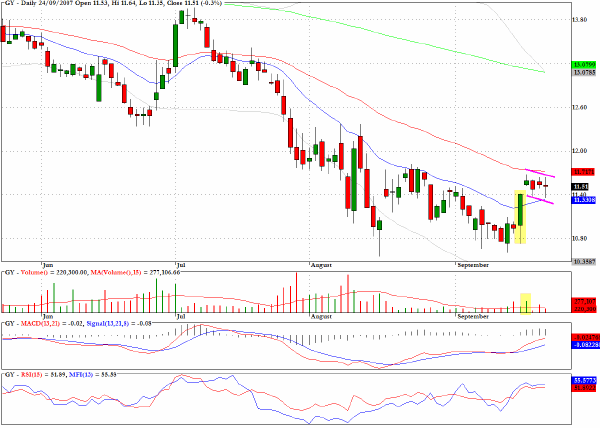
GenCorp (GY) has a mini bull flag formation but has to confront potential resistance at the 50-day EMA. Yesterday’s low volume session left a doji star formation with a minor loss but the long green candlestick from last Tuesday on heavy volume suggests that the pullback may be close to having run its course.
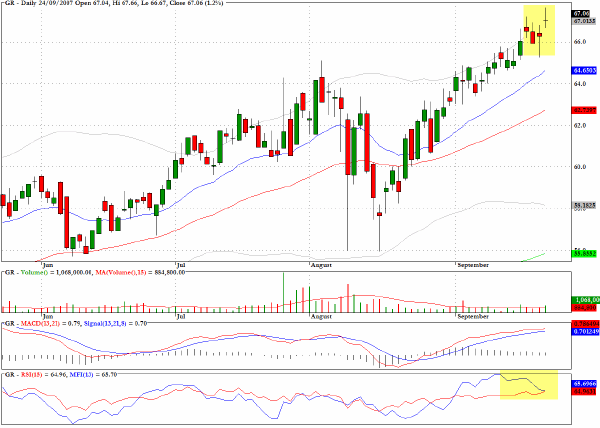
Goodrich (GR) is showing signs of a possible short term topping pattern with negative money flow divergences.
Clive Corcoran is the publisher of TradeWithForm.com, which provides daily analysis and commentary on the US stock market. He specializes in market neutral investing and and is currently working on a book about the benefits of trading with long/short strategies, which is scheduled for publication later this year.
Disclaimer
The purpose of this article is to offer you the chance to review the trading methodology, risk reduction strategies and portfolio construction techniques described at tradewithform.com. There is no guarantee that the trading strategies advocated will be profitable. Moreover, there is a risk that following these strategies will lead to loss of capital. Past results are no guarantee of future results. Trading stocks and CFD's can yield large rewards, but also has large potential risks. Trading with leverage can be especially risky. You should be fully aware of the risks of trading in the capital markets. You are strongly advised not to trade with capital.
|