Clive Corcoran will be monitoring Expeditors Intl (EXPD) today for continuation of what could be a break above a trading range that has prevailed since mid August.
As noted in yesterday’s commentary the equity market is displaying quite notable divergent behavior and this pattern was repeated again in yesterday’s trading with the Nasdaq 100 (^NDX) moving up another one percent while the DJIA and S&P 500 essentially spent the session running in place and the small cap Russell 2000 (^RUT) declined by 0.3%. Given the economic backdrop this kind of split personality market is not too surprising. The real estate sector continues to deteriorate, consumer confidence is slipping and final demand is set to erode, but all of this has to be seen in the context of what might well be the beginning of a serious Fed easing. Cynics would see this as a case of don’t fight the Fed’s desire to prevent asset deflation and perhaps even more cynically as a desire to fuel another "bubble".
The dissonant behavior is well reflected in our three sector/index charts for today where I shall focus on how yesterday’s close lies in relation to where those same indices and sectors closed immediately prior to last Tuesday’s strong upward move.
The most troubling sector appears to be the retailers and the chart for the retail index (^RLX) shows how the sector ran into resistance and was rejected as it attempted to penetrate above the 200-day EMA. Yesterday’s close brought the index well below the close from Monday, September 17. It now seems probable that the sector will want to revisit the mid August lows and a breakdown at that level would suggest that the divergences among the sectors may need to be resolved in terms of lower overall prices for equities. 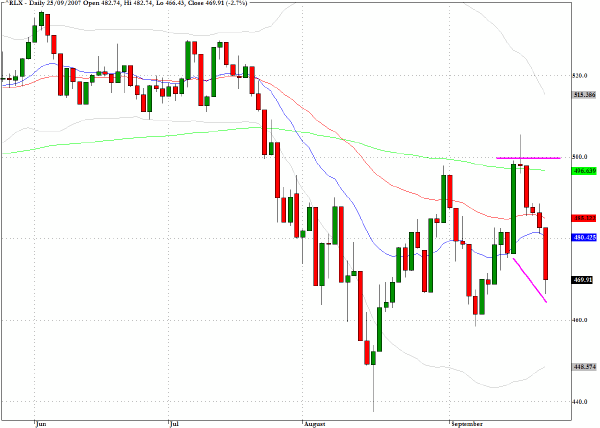
The banking index (^BKX) has retreated almost back to the level of the 17th’s close, which preceded the Fed easing. The overhead resistance on the index at 112 that we noted previously confined the upside and in reviewing the charts for the individual banking stocks there is evidence of fading momentum and money flow as amy of the stocks turned back at overhead resistance. 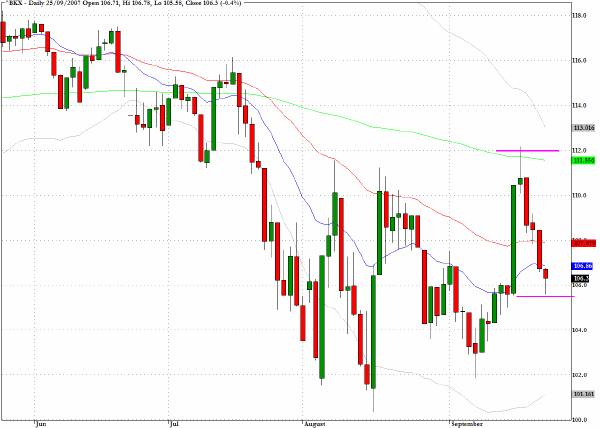
The Russell 2000 (^RUT) reached down below the pivotal 800 level in trading yesterday and on the surface, from the hammer candlestick, it would appear that the test met with buying support. However I remain to be convinced as the volume for the exchange traded fund, IWM, which tracks the index, registered less than one half of its 15 day moving average volume. 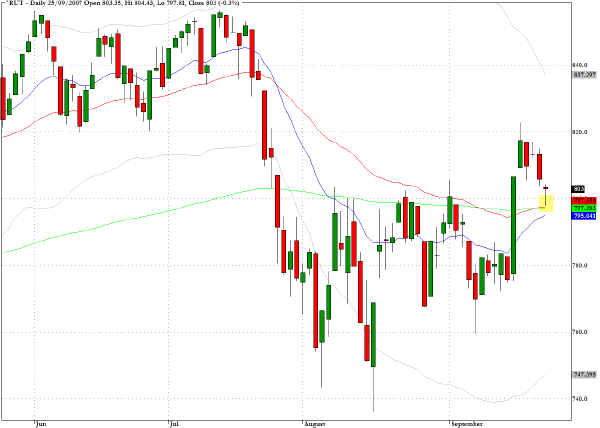
The S&P Midcap index (^MID) registered a small narrow range hammer candlestick that resembles that for the Russell 2000 both in terms of shape and proximity to key moving average levels. The index reached down in yesterday’s session to the 20- and 50-day EMA’s and closed more or less at the top of its range.
Once again the largely technical nature of the trading range yesterday and the low overall volume makes me cautious about relying on these apparently successful tests of key support levels. 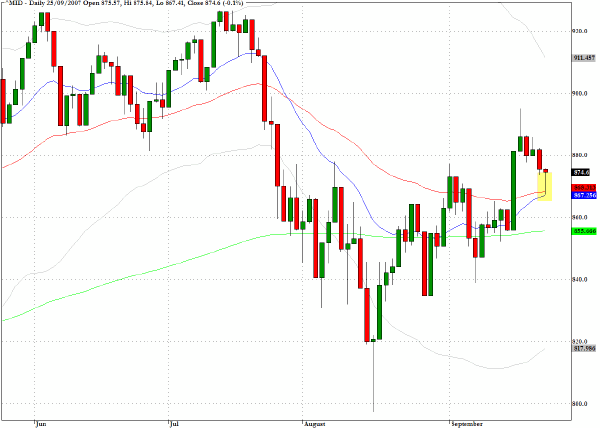
TRADE OPPORTUNITIES/SETUPS FOR WEDNESDAY SEPTEMBER 26, 2007
The patterns identified below should be considered as indicative of eventual price direction in forthcoming trading sessions. None of these setups should be seen as specifically opportune for the current trading session.
Just over a week ago I suggested that although our initial target on Yahoo (YHOO) had been achieved, the chart pattern suggested that further gains may lie ahead. The stock has moved up more than ten percent since the original recommendation but now at almost $27 appears to be reaching an area of chart resistance where some consolidation is likely. 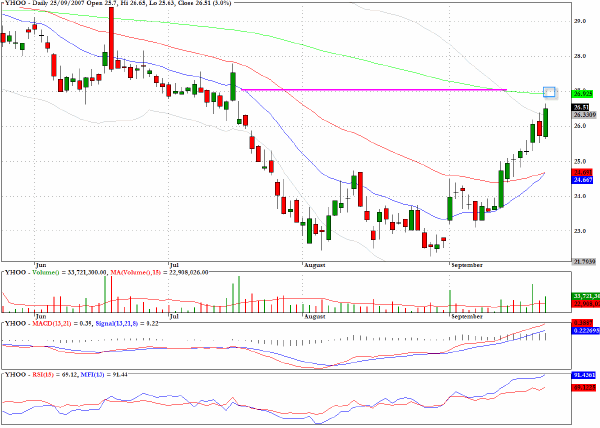
The chart for Best Buy (BBY) well illustrates the predicament of the retailers. The strong gap up on September 18th surged above the 200-day EMA the move was rejected in the next session and the pullback has brought the stock back down to the intersection of the 20- and 50-day EMA’s.
On one interpretation this pullback formation resembles a bullish flag formation. I would step aside at this juncture as the red candle at the top of the flag pole is a non-conforming feature for a bull flag and failed flag formations are often a good indicator for taking the contrary position. 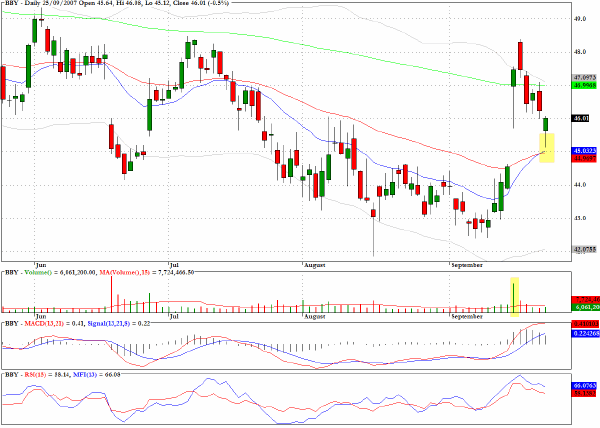
Another recommendation that has performed in line with the proposed target is Barr Pharmaceuticals (BRL) which I mentioned in the commentary for the 20th. The stock has completed the move up to the $55 level and there may be a pause and consolidation at this area of chart resistance. 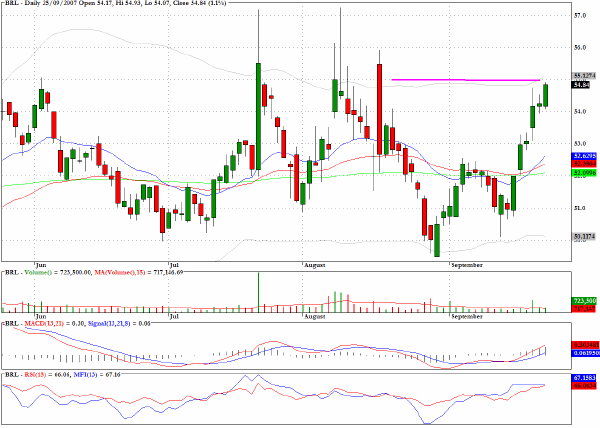
Expeditors Intl (EXPD) should be monitored today for continuation of what could be a break above a trading range that has prevailed since mid August. 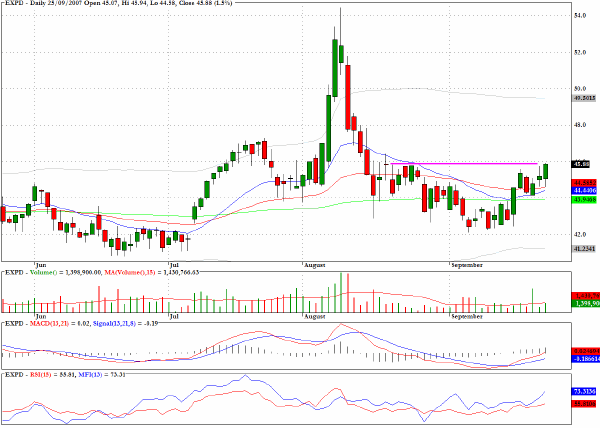
Clive Corcoran is the publisher of TradeWithForm.com, which provides daily analysis and commentary on the US stock market. He specializes in market neutral investing and and is currently working on a book about the benefits of trading with long/short strategies, which is scheduled for publication later this year.
Disclaimer
The purpose of this article is to offer you the chance to review the trading methodology, risk reduction strategies and portfolio construction techniques described at tradewithform.com. There is no guarantee that the trading strategies advocated will be profitable. Moreover, there is a risk that following these strategies will lead to loss of capital. Past results are no guarantee of future results. Trading stocks and CFD's can yield large rewards, but also has large potential risks. Trading with leverage can be especially risky. You should be fully aware of the risks of trading in the capital markets. You are strongly advised not to trade with capital.