| Corcoran Technical Trading Patterns for September 27 |
| By Clive Corcoran |
Published
09/27/2007
|
Stocks
|
Unrated
|
|
|
|
Corcoran Technical Trading Patterns for September 27
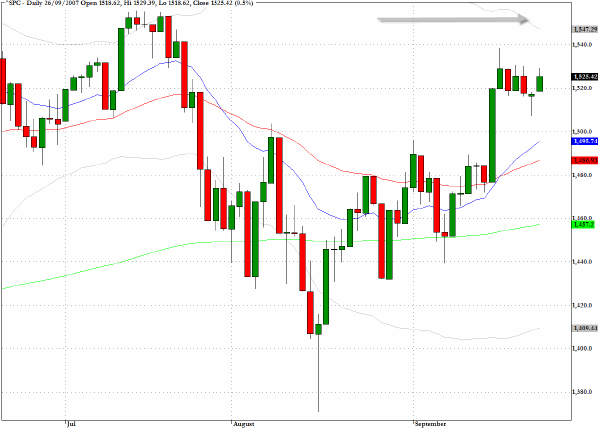
Volume remained below par yesterday as most indices made minor gains. The S&P 500 (^SPC) has effectively been stalled over the last five sessions since the celebratory rally that followed the move from the Federal Reserve. The target of the mid July highs would seem be too tempting for traders to resist and I would suspect that from a seasonal point of view - with just two trading days to go before the end of the third quarter - we could well see a move up towards 1550 and possibly beyond.
The divergences that I have been mentioning over the last few sessions, and the increased volume that is to be expected in October, may require fund managers, as we enter the fourth quarter, to re-evaluate their anxious optimism that has characterized the nervously bullish tone to trading since the market moved beyond panic mode in mid August.
In yesterday’s commentary and during my contribution to CNBC’s European Closing Bell yesterday afternoon I discussed the chart that most intrigues me at present which is for the Nasdaq 100 (^NDX). Slightly less intriguing is the chart for the broader Nasdaq Composite (^IXIC) which is revealing several chart formations that are often seen at or near to exhaustion highs.
Spinning top candlesticks and doji star patterns that could become island formations are being registered at the moment and despite my willingness to believe that there is an enormous amount of capital on the sidelines waiting to be deployed I think the divergences and the relatively low volume conditions of late are good reasons to be wary.
We may be close to another tradable correction and that could arise during the course of next week as traders prepare for the employment data that may be discounted before the event as being weaker than market expectations.
If the data proves to be better than expected and consumer related stocks such as the retailers bounce the dissonant action amongst key sectors will be less worrisome.

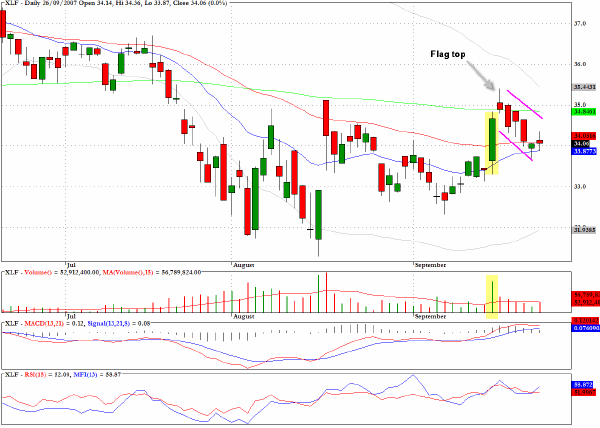
The exchange traded fund, XLF, whose constituents come from the financial services sector, is presenting a slightly unorthodox bullish flag formation which could be pointing to an impending rally.
My only concern is that the candlestick that I have marked as the flag top has a long tail that coincides exactly with the 200-day EMA. A similar pattern is visible on the KBW Banking Index chart (^BKX) reviewed yesterday. This barrier should be breachable if the underlying market dynamics are to favor a bullish scenario for the remainder of this year.
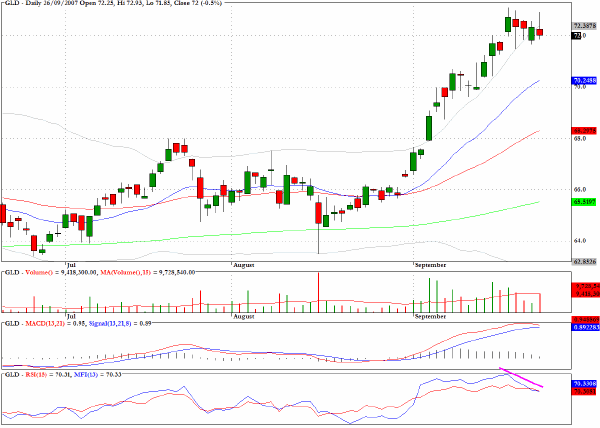
As expected Gold encountered firm resistance in the vicinity of the $730 level that marked the previous highs from May, 2006. Many of the mining stocks declined sharply yesterday and it would not be surprising to see a tradable correction in the precious metal in coming sessions.
However this may turn out to be a short-lived and not steep correction and could be the prelude to further strength for the metal and the mining stocks later in the year.
TRADE OPPORTUNITIES/SETUPS FOR THURSDAY SEPTEMBER 27, 2007
The patterns identified below should be considered as indicative of eventual price direction in forthcoming trading sessions. None of these setups should be seen as specifically opportune for the current trading session.
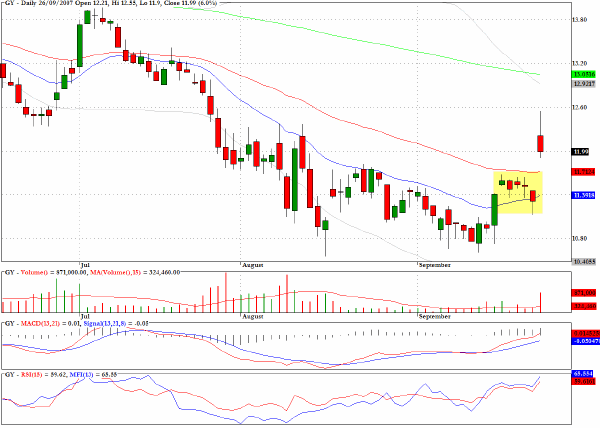
GenCorp (GY) was cited in Tuesday’s column as being close to completion of a bullish pullback pattern. The stock provided a decent entry opportunity in Tuesday’s trading and the stock surged by ten percent intraday yesterday despite closing poorly and still resulted in a six percent gain on the day.
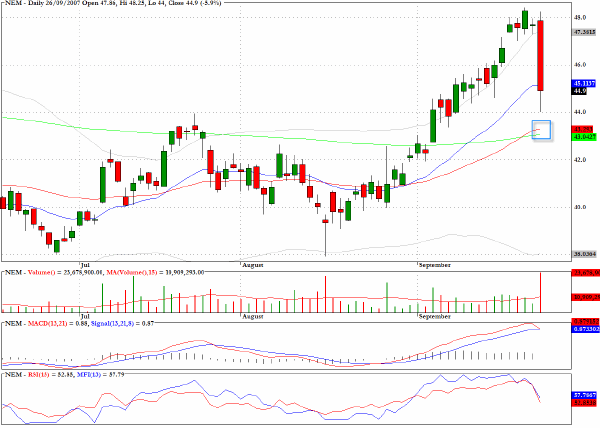
Among the gold mining stocks there were several that tumbled in yesterday’s session including Newmont Mining (NEM) that dropped by almost six percent on very substantial volume. I would expect the slide to continue a little further towards the $43 level but for longer term position players that favour the metal’s prospects this could represent a value area.
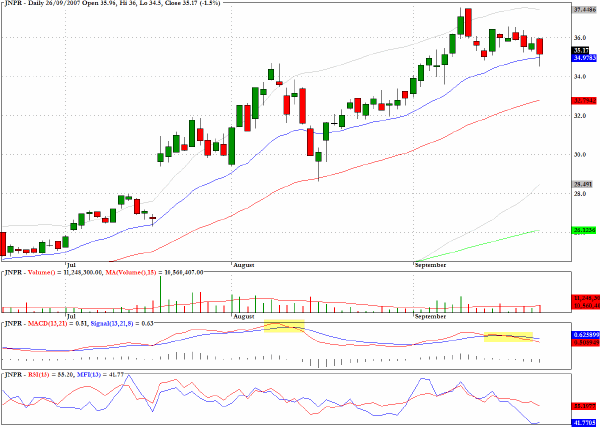
Some negative divergences are apparent on the chart for Juniper Networks (JNPR).
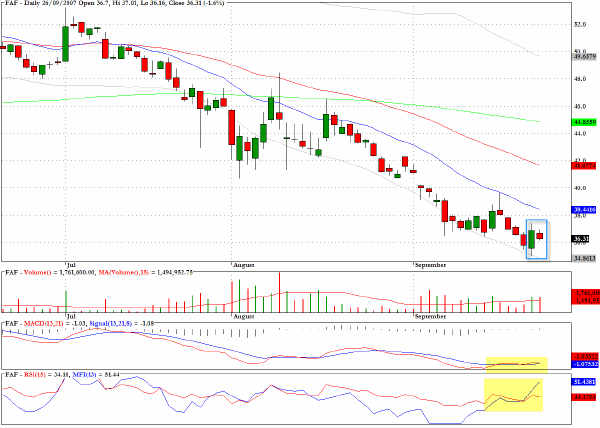
Calling bottoms precisely is not something that I recommend but the chart for First American (FAF) has clearly positive MFI divergences and yesterday’s inside session might prove to be an inflection point.
Clive Corcoran is the publisher of TradeWithForm.com, which provides daily analysis and commentary on the US stock market. He specializes in market neutral investing and and is currently working on a book about the benefits of trading with long/short strategies, which is scheduled for publication later this year.
Disclaimer
The purpose of this article is to offer you the chance to review the trading methodology, risk reduction strategies and portfolio construction techniques described at tradewithform.com. There is no guarantee that the trading strategies advocated will be profitable. Moreover, there is a risk that following these strategies will lead to loss of capital. Past results are no guarantee of future results. Trading stocks and CFD's can yield large rewards, but also has large potential risks. Trading with leverage can be especially risky. You should be fully aware of the risks of trading in the capital markets. You are strongly advised not to trade with capital.
|