| The McMillan Options Strategist Weekly |
| By Lawrence G. McMillan |
Published
09/28/2007
|
Options
|
Unrated
|
|
|
|
The McMillan Options Strategist Weekly
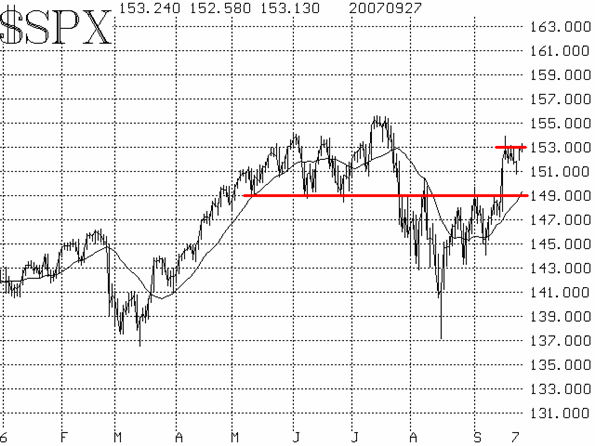
The Fed's aggressive action in lowering interest rates last week spurred the broad market to break out on the upside. This pertains to nearly every major index, but most specifically we are watching for support at the 1490 level on $SPX and the 804 level on the Russell 2000 Index ($RUT).
After a classic breakout, there should be a period of rest and a pullback towards that support. That's what has taken place this week, although it's been much more evident in the Russell than in $SPX (where the pullback has been minuscule so far). These index charts read "bullish" to us as long as they remain above the support areas.

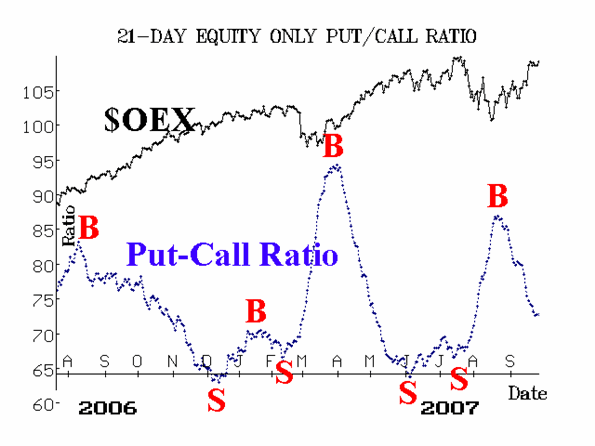
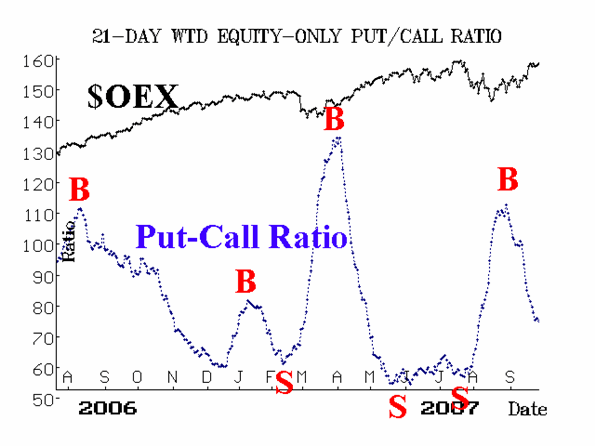
Equity-only put-call ratios have been on buy signals for several weeks now, and they continue to stay there. While the ratios (Figures 2 & 3) are now declining at a rapid pace, they will remain bullish as long as they continue to decline. They will only turn bearish if they roll over and begin to rise -- no matter at what level that might occur. At this point, these ratios don't look to be ready to roll over to sell signals any time soon.


Market breadth has been doing its usual thing -- following the market around. As such, it remains best used as a confirming indicator rather than a leading one. It was the only indicator that turned bearish this week, but now that breadth has improved over the last two days, the recent breadth oscillator sell signals have been canceled.
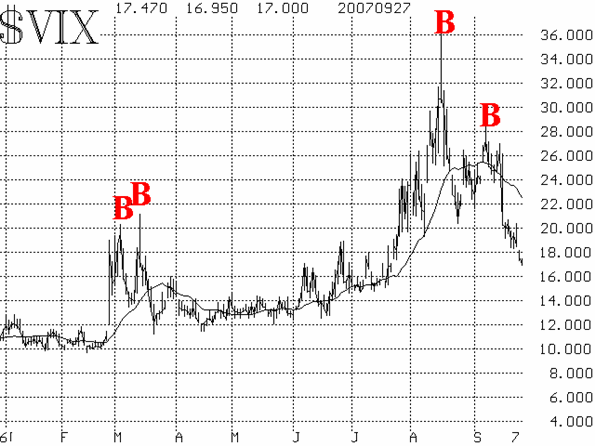
Finally, the volatility indices ($VIX and $VXO) continue to decline, and that is bullish. $VIX is now back below 19, a level above which it had remained for about six weeks. Moreover, the 20-day moving average of $VIX is declining, and that is bullish, too. $VIX
may not return all the way to its spring lows, but rather settle somewhere in the mid-to-high teens, at least for now.

In summary, the picture is bullish. At this point, there is minor resistance at 1530 on the $SPX chart, but a close above there would likely signal the market is ready to challenge and exceed its all-time highs near 1555.
Lawrence G. McMillan is the author of two best selling books on options, including Options as a Strategic Investment, recognized as essential resources for any serious option trader's library.
|