| Corcoran Technical Trading Patterns for October 1 |
| By Clive Corcoran |
Published
10/1/2007
|
Stocks
|
Unrated
|
|
|
|
Corcoran Technical Trading Patterns for October 1
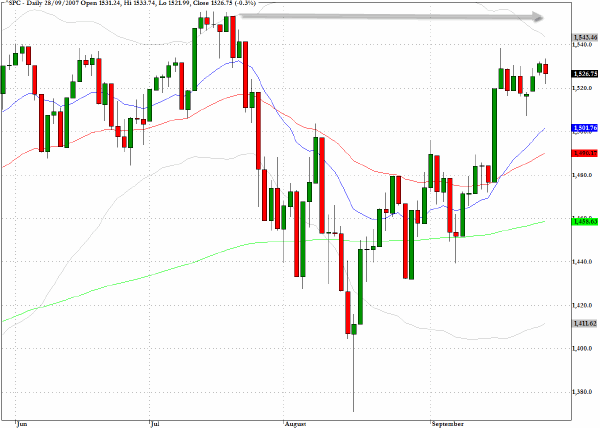
The third quarter closed with a relatively quiet session with subdued volume and small intraday ranges registered for most indices. The S&P 500 remains tantalizingly close to the mid-July highs and it must be assumed that the tempation to test this level will prove to be too much to resist in coming sessions. However, the week ahead will almost certainly see an increase in the volatility that is often seen during the month of October as the market faces a potentially disruptive event when the employment data is released on Friday. Traders will be looking to discount this event during the course of the week, and as well there is the likelihood that Friday itself could see significant intraday moves.
Trading during the second half of September saw a diminution in volatility but one of the indicators that I follow, which measures the correlations between market sectors, is indicating that we are still within an episode of unusually enhanced correlated movements between disparate sectors. This suggests that the turbulent conditions from August, while they have abated since the recent Fed easing decision, are still in evidence beneath the surface.
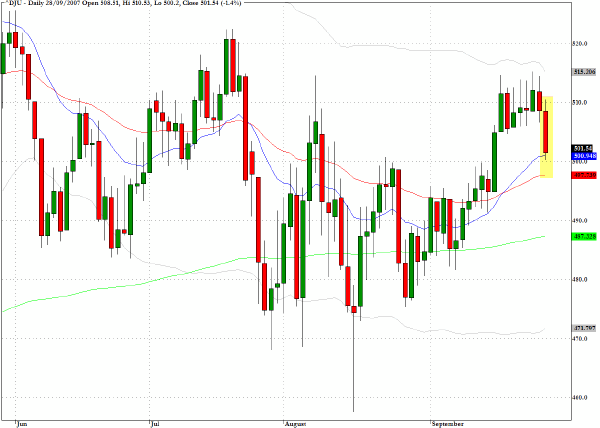
Another index that I will be monitoring in the coming week is the Dow Jones Utilities index (^DJU) which performed poorly in Friday’s session. In a slowing economy with a supposition that there will be declining long term interest rates, one would expect this sector to be a defensive play for asset managers attracted to the attractive income from these securities with reliable dividends. The activity in the gold market which saw a multi year high for the precious metal at the end of last week could be a factor that is unnerving some asset managers as to how reliable the prospects are for declining yields at the long end of the Treasury Bond spectrum.
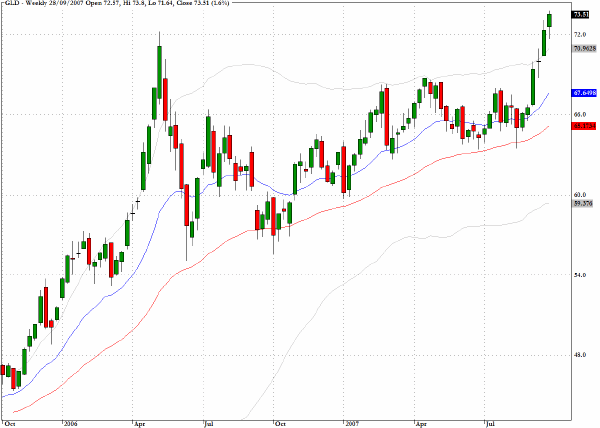
COMEX Gold futures for December delivery jumped more than $10, or 1.5%, to end the quarter at $750 an ounce on the NYMEX. As the weekly chart below for the exchange traded fund, GLD, which tracks the precious metal, shows the metal is now trading above the May 2006 highs and at levels not seen for more than twenty seven years. The record intraday all-time high for a benchmark gold futures contract on Nymex stands at $875 from Jan. 21, 1980.
Continued weakness of the dollar, booming commodity prices and a Federal Reserve that may be trapped into a policy of easing, raises the risk that the inflation genie may not only be out of the bottle but there is little that can be done to get it back in. Monitoring the direction of the gold market including the mining stocks, the utilities and the yields on the 30 year bond would also be advisable as a useful gauge as to how much volatility could become a factor in the coming month.
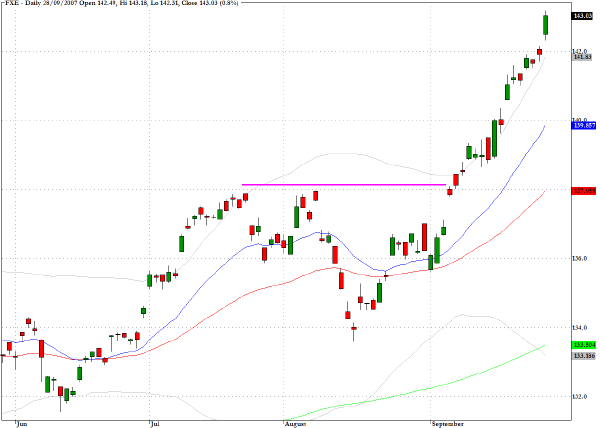
In Friday’s trading the dollar continued its downward trajectory against most currencies and especially the euro. The currency for the EU made a succession of historic highs last week and the selling pressure seems to be relentless as global asset managers that want exposure to US capital markets also want to hedge their exposure to a currency which seems increasingly to be taking on the characteristics of a one way bet - downwards.
Although the dollar has been weaker against the Japanese yen, against a basket of major global currencies, the dollar is at historically low levels and this seems to have been accepted stoically by asset allocators as the price to be paid for rescuing the US economy from a drastic slowdown. As the previous discussion suggests the largest impact from the dollar’s decline may be felt by US consumers in the form of higher final product prices as cost inflation will be most acutely felt in an economy where the currency’s purchasing power is diminishing the most.
TRADE OPPORTUNITIES/SETUPS FOR MONDAY OCTOBER 1, 2007
The patterns identified below should be considered as indicative of eventual price direction in forthcoming trading sessions. None of these setups should be seen as specifically opportune for the current trading session.
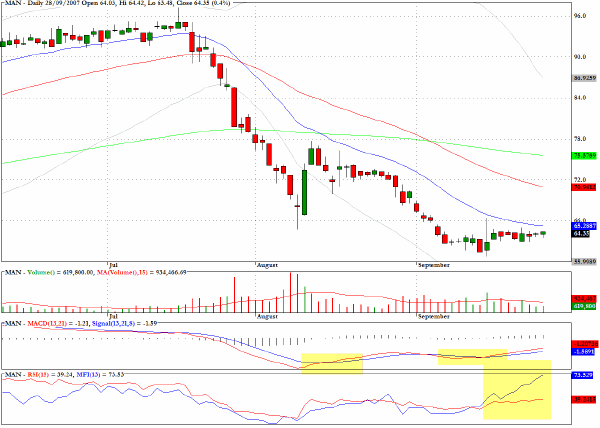
The chart for Manpower (MAN) reveals a basing pattern with positive divergences on both the MACD and MFI chart segments.
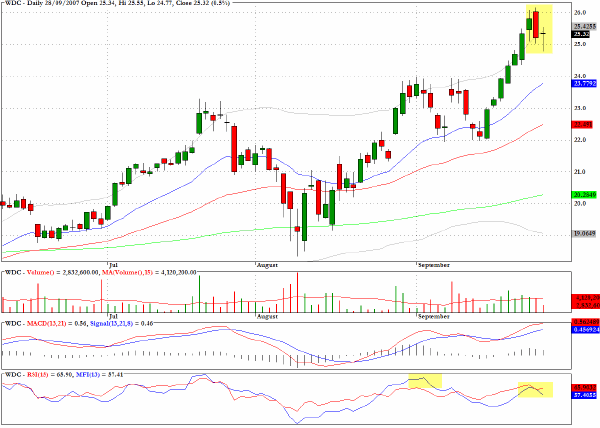
Western Digital (WDC) is showing some evidence of declining momentum and I shall be watching this for further signs of corrective price action.
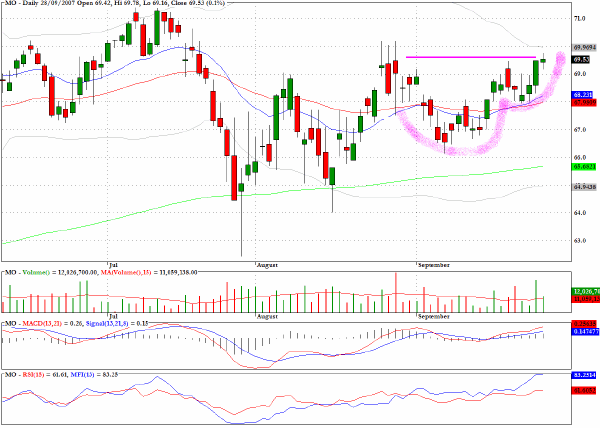
The pattern for Altria (MO) is quite intriguing with a cup and handle pattern that has formed as the stock is attempting to break above the $70 level. A clear break through that barrier could see the stock ready to mount an assault on mid July all time historic highs.
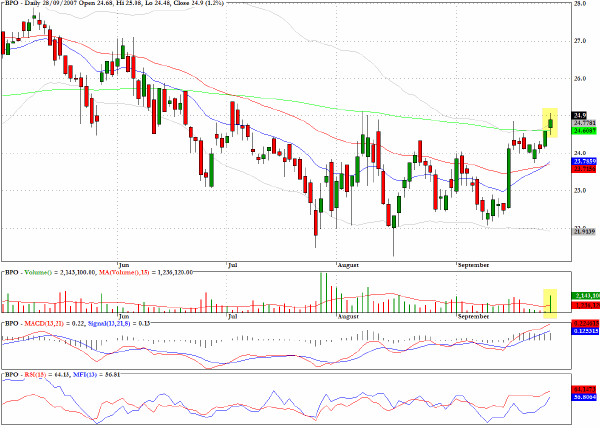
Business Objects (BOBJ) peeked and closed above the 200 day EMA on heavy volume in Friday’s trading.
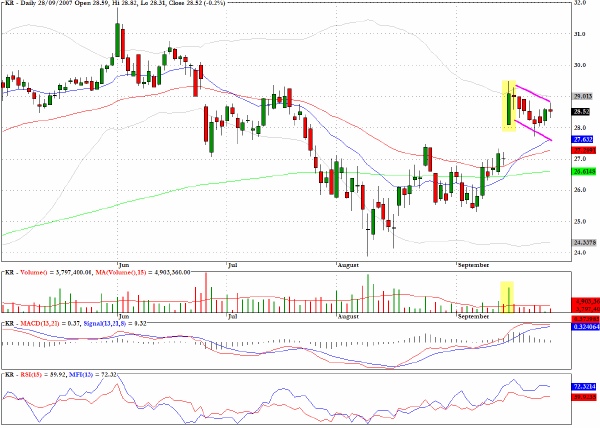
Kroger (KR) has a bull flag formation with an exemplary pullback and volume pattern. One further test of the lower bounds of the pullback channel may be on the cards but the trade has a favorable reward/risk ratio.
Clive Corcoran is the publisher of TradeWithForm.com, which provides daily analysis and commentary on the US stock market. He specializes in market neutral investing and and is currently working on a book about the benefits of trading with long/short strategies, which is scheduled for publication later this year.
Disclaimer
The purpose of this article is to offer you the chance to review the trading methodology, risk reduction strategies and portfolio construction techniques described at tradewithform.com. There is no guarantee that the trading strategies advocated will be profitable. Moreover, there is a risk that following these strategies will lead to loss of capital. Past results are no guarantee of future results. Trading stocks and CFD's can yield large rewards, but also has large potential risks. Trading with leverage can be especially risky. You should be fully aware of the risks of trading in the capital markets. You are strongly advised not to trade with capital.
|