|
Weekly Outlook in the Stock Market
It was an interesting week we saw last week. The indices are not only sensing a mixed message by themselves, they're collectively a little at odds. So this week, we're only going to try and explain the good, bad, and the ugly about each chart.
NASDAQ Composite Commentary
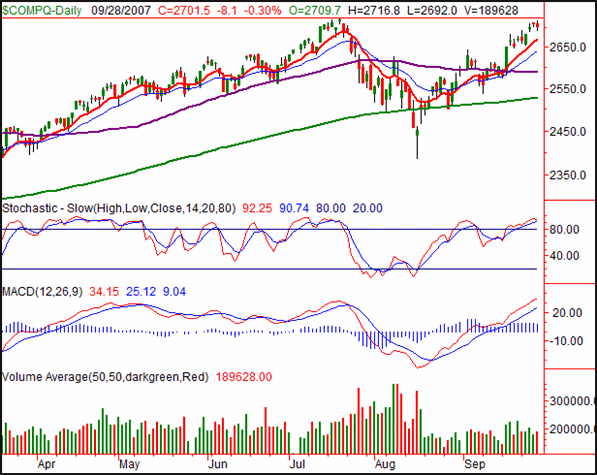
The NASDAQ Composite closed at 2705.5 on Friday, a loss of 8.1 point (-0.3%) for the day, and a gain of 30.3 points (+1.13%) for the week. More importantly, Friday's high of 2716.8 is just a hair under the most recent peak from 2724.7. On the verge of a breakout, yet now well overbought, we find the composite is at a crossroads.
The line to watch is 2724.7, July's peak. A move past there would be new multi-year highs, and could inspire another wave of buying. Friday's high? 2716.80, very close to the recent high. Though the NASDAQ is indeed overbought, the market just may not care.
As for support, this is tricky. Normally we'd use the 10- and 20-day lines as starting points. But, the last two weeks have been so strong, the NASDAQ has really diverged from them by several points, more so than we've seen in months.
The 10-day average (red) is at 2671, while the 20-day average (blue) is at 2640. Those are the key support lines. The only key resistance line at this point is 2724.7.
NASDAQ Composite - Daily

S&P 500 Commentary
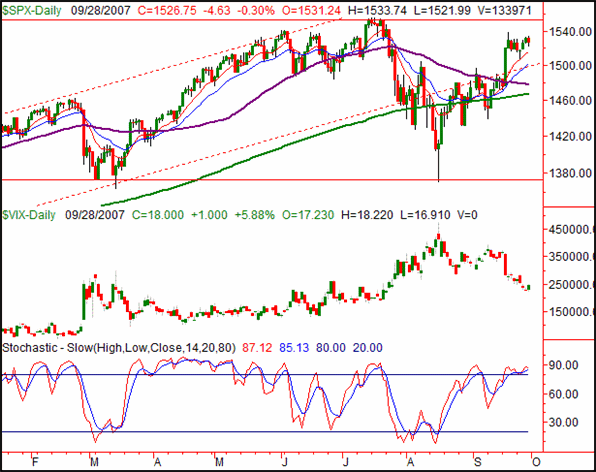
On Friday, the S&P 500 fell back by 4.63 points, or -0.3%. That close of 152.75 was only one point above the previous week's close, translating into a gain of 0.07%. Let's call it a break-even. Though a quick glance at the chart suggests bullishness still remains, a couple of pitfalls have worked their way into the picture.
Pitfall #1: We're overbought, stochastically. It's not the end of the world, but a bearish concern.
Pitfall #2: The VIX is rising again, after having shown us a pretty steep fall. Maybe it's ready to rebound on a fairly large scale. Let's not over-react, as last Friday's big push higher for the VIX still hasn't changed the bigger-picture downtrend. However, it's starting to press higher right as some other things are happening as well.
Even so, the overall trends remains bullish.
Support and resistance? Support is being made by the 10- and 20-day lines at 1516 and 1501. Resistance is at the recent high of 1555, a multi-year high, which has some pretty big implications.
S&P 500 - Daily

Dow Jones Industrial Average Commentary
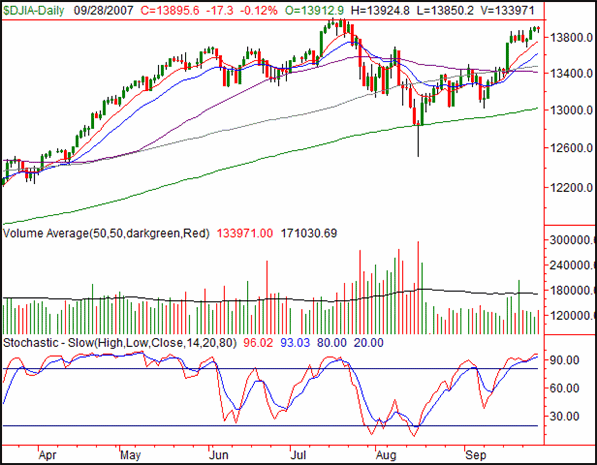
Though the Dow's close 13,895.6 on Friday was a loss for the day (-17.3 points, -0.12%), it was still a gain for the week (of 75.4 points, or +0.55%). This chart is most akin to the SPX's, and looks bullish overall, but suspiciously overbought - not to mention a lack of volume behind the recent move higher. Yeah, the Dow is fairly close to new multi-year highs, but we're not there yet.
The line in the sand is at 14,022, the high from July 17. The high from last week was 13,925, only 97 points under the July high (a distance that could be covered with just one good day). If we can break to new multi-year highs, that may well be enough inspiration to prompt more rally.
The problem is, we're stochastically overbought. And, volume hasn't been great either. While it's true that volume isn't off the charts in a typical September, this time around it was strangely low. So, it's not like we know this is the majority opinion. On the flipside, however, the market stayed overbought for weeks on end in April and May.
We're looking for support at the 10- and 20-day lines (the 20-day line at 13,618 woud be a more meaningful support area), with resistance at 14,022.
Dow Jones Industrial Average - Daily

Bottom Line
Notice how the NASDAQ led the way last week. In fact the NASDAQ has been leading he way for the last three weeks. This is a subtle hint that traders are looking for more aggressive names than the safe ones that are found in the Dow, or even the S&P 500. On the other hand, the poor volume has us wondering if the recent uptrend is just a symptom of a mere lack of sellers, and not an abundance of buyers.
At this point the momentum is bullish, so we have to be as well. In fact, even a slight pullback from current levels wouldn't undo the bullish trend, as long as the short-term support lines like the 20-day averages held up. (If they break, then get concerned.) If on the other hand the resistance levels (the recent highs) break, we could see stocks move higher for a short while. We don't think that would be a very prolonged rally though, as the market is already overbought as it is, a big rally now would only compound that problem. It could make for a nice swing trade though.
Price Headley is the founder and chief analyst of BigTrends.com.
|