| Components of a Head and Shoulders Reversal |
| By Andy Swan |
Published
10/1/2007
|
Currency , Futures , Options , Stocks
|
Unrated
|
|
|
|
Components of a Head and Shoulders Reversal
The best known and most reliable major reversal pattern in technical analysis is the Head and Shoulders Reversal. Other patterns are variations of the Head and Shoulders, so let's discuss this major reversal pattern thoroughly as it applies to stock trading and options trading techniques.
The Head and Shoulders major reversal pattern, like other reversal patterns, is a refinement of the concepts of trend. For example, picture a major uptrend where the ascending peaks and valleys begin to lose momentum, and the uptrend levels off for a while. During this distribution phase, supply and demand forces are in relative balance. Once this phase is completed, support levels along the bottom of this trading range are broken and a downtrend is established. Now our peaks and valleys are descending.
Look at the head and shoulders graph below. At point A, our uptrend has no sign of a top. It's normal for the volume to expand on the price moves to a new high. When the correction dips down to point B, it's on lighter volume, which is also normal. Then a yellow caution light goes on for our trader at point C. He notices the volume on the upside breakout of point C is a bit lighter than the previous rally of point A.
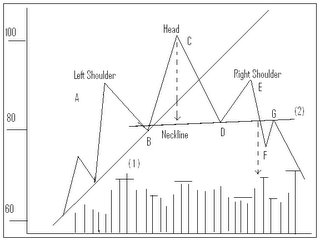
Our prices begin to decline to point D. Our trader's caution light starts flashing a little brighter as the decline carries below the peak of point A. The reason for more alarm here is in an uptrend a penetrated peak should function as support on subsequent corrections and our decline has fallen well under point A, almost to the previous reaction low at point B.
The market rallies again to point E on even lighter volume and is unable to reach the previous peak of point C. Since an uptrend requires each high point exceed the previous peak, he may be looking at the beginning of a downtrend.
Another danger sign of a possible trend reversal is when the major up trendline (line 1) is broken at point D. Despite all these signals, all the trader is really sure of at this point is that the trend has shifted into a sideways trend. At this time, our day traders may feel it's time to liquidate long positions, but they are not secure enough to initiate new short sales.
A flatter trendline, or neckline (line 2), can be drawn under the reaction lows at points B and D. The neckline is generally drawn at a slightly upward slope but can be horizontal, yet rarely slants downward. The deciding factor in the resolution of the head and shoulders top is a decisive closing violation of that neckline. Once the market has violated the trendline along the bottoms of B and D, and has broken under support at point D, it has completed the requirements for a downtrend. The new downtrend can be seen in the descending peaks and valleys at points C, D, E, and F. Volume should increase upon breaking the neckline, but a sharp increase in downside volume is not critical.
The trader may see a return move, which is a bounce back to the bottom of the neckline. The previous reaction low at point D and point G have now become overhead resistance. Volume helps determine the size of the return move, and if it occurs at all, it may only be a minor bounce. Breaking the neckline on lighter volume increases the likelihood of a return move.
Summary of Basic Ingredients for Head and Shoulders Reversal:
1. There's a prior uptrend.
2. There's a left shoulder on heavier volume followed by a corrective dip (Points A & B).
3. A rally into new highs on lighter volume (Point C).
4. A decline moving below the previous peak (A) and approaching the previous reaction low (Point D).
5. There's a third rally point on noticeably lighter volume (Point E) that fails to reach the top of the head (Point C).
6. A close below the neckline
7. A return move back to the neckline (Point G) followed by new lows.
There are three will defined peaks in our graph. The middle peak, the head, is slightly higher that the left or right shoulders. However, it is not decisively a Head and Shoulders pattern until the neckline is broken on closing. Here, the trader can use either the 1-3% penetration criterion or the two-day rule for added confirmation.
Andy Swan is co-founder and head trader for DaytradeTeam.com. To get all of Andy's day trading, swing trading, and options trading alerts in real time, subscribe to a one-week, all-inclusive trial membership to DaytradeTeam by clicking here.
|


 Free Festival of Traders Videos