In this weekend's Weekly Outlook, we were generally bearish in the short-term, but also recognized that this market had gotten pretty good at headfakes this year. So, a lot of our downside expectation was going to depend on how we started this week. Were the buyers going to strike back, scooping up the shares that had been beaten up on Thursday and Friday? Or would the bulls let the sellers stay in control, after turning it over to them in the last part of last week? After Monday, it's much more clear now that we have to brace for a little more downside - this isn't "just a little volatility." Today, we'd like to take a really detailed look at our index charts, now that things have gone from bad to worse.
The S&P 500
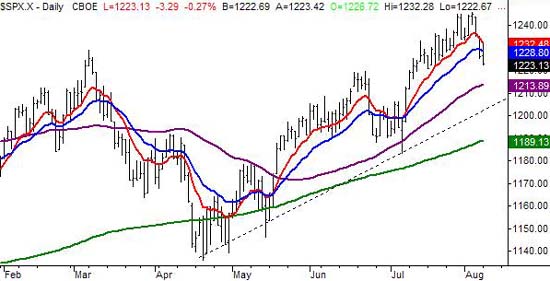
The confirming sell signal for us is the second close under a key moving average that's also lower than the previous close. In other words, not only did we need to see the S&P 500 close under the 20 day line (blue) at 1228.80 to be fully bearish, we also needed to see a close under Friday's low of 1225.62. We go both, when the SPX closed at 1223.13 on Monday. Compounding the bearish chart is the fact that the 10 day line acted as resistance on Friday as well as Monday.
So what's next? This gets a bit tougher. The 50 day line and the 200 day line really didn't hold up as support the last time we visited them. They were generally in the area where the index bounced, but it was a loose support area. If anything, the straight-line support (dashed) is the likely area where we'll finally land. It's currently at 1202 and rising. On the other hand, seeing how iffy support has been all year, we'd be hesitant to predict any support area until it was clear stocks were recovering. In the meantime, we're gearing up for a bit of selling. The only thing that will negate this bearish opinion - and this is important to know - is a close back above the 10 day average. That means we could still see a couple of bullish days, and it wouldn't undo this new downtrend. Don't mistake a little bullishness for a recovery.
S&P 500 - Daily Chart

The Dow Jones Industrial Average
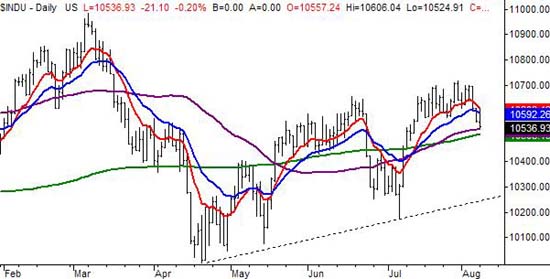
We didn't review the Dow Jones Average in the Weekly Market Outlook, so let's go over the important pieces of this chart here. In a nutshell, the Dow has been the weakest of the three major indexes, never even threatening to break to new highs a few days ago. The Dow fell under the 10 day line on Friday, and also found resistance there on Monday. What's unique about the Dow, though, is that al bluffs are being called - the Dow is resting right on the 50 day line at 10, 526.68. If the 50 day average is indeed going to be support, it's got to do it now. The 200 day line is just at 10,508.16, so it's on the verge of breaking too. Neither have been very good support this year, however, so we'll actually look to the straight-line support here too. It's currently at 10,240. Again, the trump card is a close above the 10 day average, currently at 10,608.
The Dow Jones Industrial Average - Daily Chart

Crude Oil
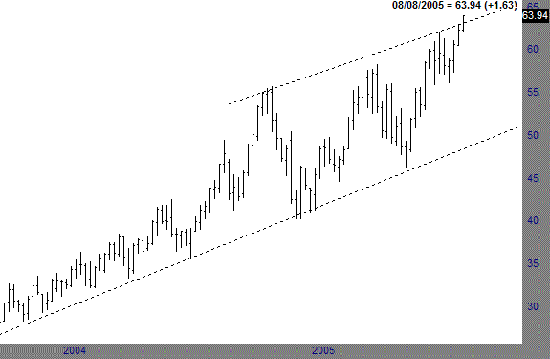
Crude oil hit new highs around $64 yesterday. With the market moving sharply lower, most of the media cited "stocks lower on higher oil prices". Sounds good, but it's not exactly true. Stocks were headed lower anyway. Old was headed higher anyway. The two are a little more independent than a lot of the media is willing to acknowledge. Just as often as they move in opposite directions, they also move in the same direction. However, you never seem to hear "stocks rallied on higher oil prices today". It just doesn't sound as interesting, does it? I have no problem saying the two are generally related. I just think it would pay to be careful about what's a cause and what's an effect.
Regardless, crude hit new highs yesterday. We're not surprised. A lot of pundits were sure that the previous high would be the ultimate peak....and some were sure the high before that, and the high before that, and the high before that......We think oil will pull back from here. It has every time it's hit a new high. But, oil is still trending higher in the bigger picture. It's been great for 'trading', but if you're making a long-term bet on this being the ultimate peak, just be careful. A short-term peak? Yes, probably. But, until crude breaks under it's long-term support level - at 49 - we've got no reason to think anything major has changed.
Crude Oil - Weekly Chart

Price Headley is the founder and chief analyst of BigTrends.com.