| Corcoran Technical Trading Patterns for October 2 |
| By Clive Corcoran |
Published
10/2/2007
|
Stocks
|
Unrated
|
|
|
|
Corcoran Technical Trading Patterns for October 2
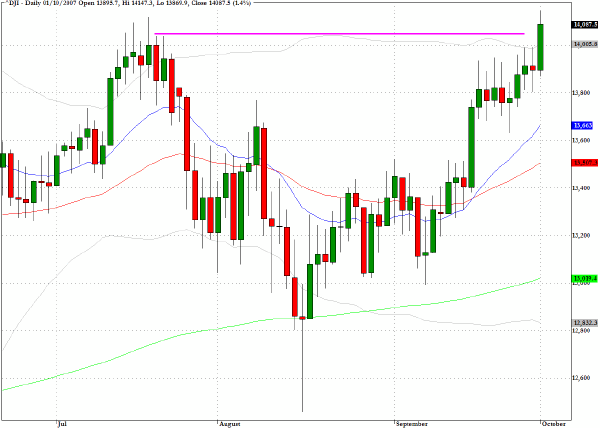
Exuberance appears to be increasing as the DJIA broke above its previous closing high yesterday and recorded an almost 200 point gain. Both of the widely followed Nasdaq indices, ^NDX and ^IXIC, also registered multi-year highs while the S&P 500 (^SPC) stopped just short of its mid July high.
The merrymaking has also continued in some Asian markets with Hong Kong’s Hang Seng Index moving up almost 1000 points to reach a new closing high that lies about 40% percent above the intraday lows recorded just six weeks ago.
There is no denying that sentiment is profoundly bullish as all news at present is perceived as being supportive of further easing by the Fed and evidence that the worst of the credit market turmoil is behind us. Just how fragile this buoyancy is remains to be seen but in the current market environment one needs to be cautious about taking on too much long exposure and yet there are very few setups in scans of individual stocks that are obvious shorts.
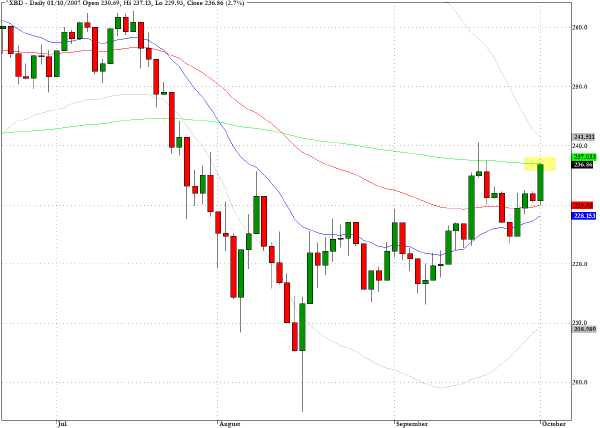
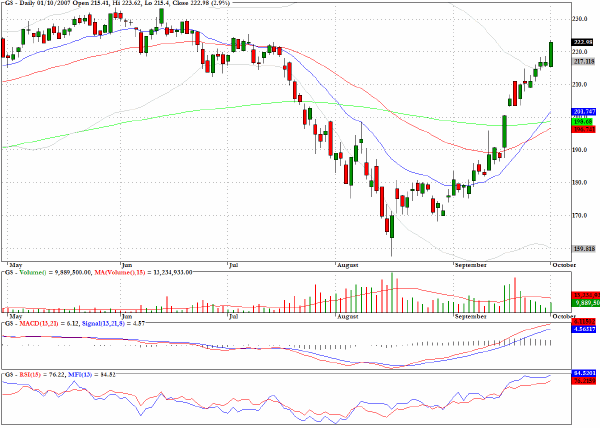
Large write-downs by Citigroup(C) and UBS failed to dent sentiment in the financial sector but both of the major indices that I track in this arena ^BKX and ^XBD are still below their respective 200 day EMA’s. The broker/dealer index closed almost exactly at the 200 day EMA level and as reviewed below some of the investment banks, such as Goldman Sachs (GS) are close to completing a V shaped recovery off the August lows, while others such as Merrill Lynch (MER) are still closer to their August lows than they are to their own 200 day EMA.
Clearly the investment banks are on different trajectories at present and, uncharacteristically, the sector is not performing in a uniform and coherent fashion.
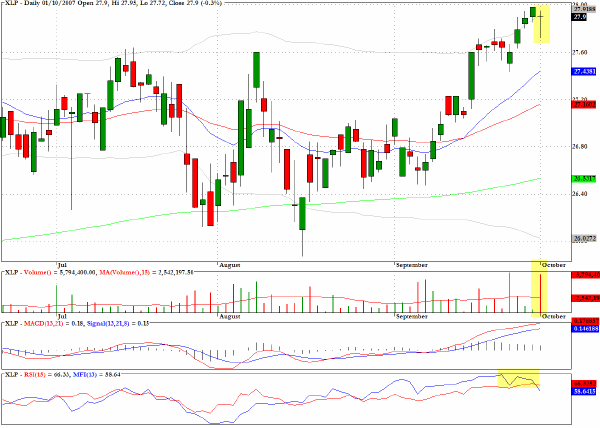
One sector chart that captured my attention is for the consumer staples stocks, XLP, which registered a marginal loss with a doji star formation on very heavy volume. This could represent an inflection point as capital that had been allocated defensively to this sector over the last few weeks is being tempted away into more dynamic and high-flying sectors.
TRADE OPPORTUNITIES/SETUPS FOR TUESDAY OCTOBER 2, 2007
The patterns identified below should be considered as indicative of eventual price direction in forthcoming trading sessions. None of these setups should be seen as specifically opportune for the current trading session.
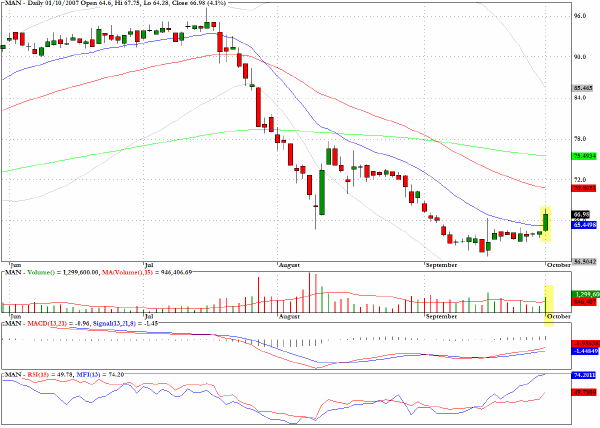
Our comment yesterday morning that the chart for Manpower (MAN) was revealing a basing pattern with positive divergences on both the MACD and MFI chart segments proved to be timely with a good entry opportunity and a four percent gain for the day.
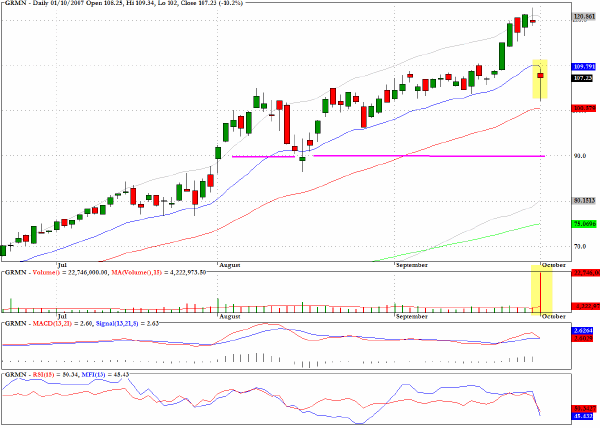
Nokia’s decision to acquire Navteq (NVT) for $8 bn did not sit well with some analysts and shareholders of sat nav manufacturer Garmin (GRMN). The acquisition of the electronic map maker will almost certainly lead to increased costs for Garmin and the entry of the mobile handset powerhouse into the geo positioning market place provides another competitive dynamic in what is becoming a very rapidly growing market.
Interestingly Europe’s major sat-nav player TomTom NV (which is traded on the Amsterdam exchange) and which is the market leader throughout Europe recently acquired one of the other major map suppliers TeleAtlas. TomTom is also ramping up its operations in North America. Garmin is now facing a clear challenge in its strategic marketing and the chart suggests that a move back towards the $90 level could be seen in the intermediate term.
Goldman Sachs (GS) has made a remarkable recovery from peeking below $160 in mid August to now being within points of its mid July highs. This is not the first time that this stock has shown extraordinary recovery capabilities and probably it is not the last time either.
Clive Corcoran is the publisher of TradeWithForm.com, which provides daily analysis and commentary on the US stock market. He specializes in market neutral investing and and is currently working on a book about the benefits of trading with long/short strategies, which is scheduled for publication later this year.
Disclaimer
The purpose of this article is to offer you the chance to review the trading methodology, risk reduction strategies and portfolio construction techniques described at tradewithform.com. There is no guarantee that the trading strategies advocated will be profitable. Moreover, there is a risk that following these strategies will lead to loss of capital. Past results are no guarantee of future results. Trading stocks and CFD's can yield large rewards, but also has large potential risks. Trading with leverage can be especially risky. You should be fully aware of the risks of trading in the capital markets. You are strongly advised not to trade with capital.
|