| Corcoran Technical Trading Patterns for October 4 |
| By Clive Corcoran |
Published
10/4/2007
|
Stocks
|
Unrated
|
|
|
|
Corcoran Technical Trading Patterns for October 4
Yesterday I commented on the abrupt intraday reversal experienced by the Hang Seng index (^HSI) where, after reaching a historic high, the index reversed in the latter part of the session to close with a 2.5% decline. The decline continued in trading today with a gap down open and a further drop of 1.8%.
The chart for the Hong Kong index below is really quite extraordinary and reflects what has been happening recently in a variety of overseas markets. The move off the mid-August lows took the index in almost a vertical fashion up forty percent in six weeks. This type of action inevitably will bring about quick corrections, and perhaps that is all that we are witnessing in the last two sessions. But there is a lingering doubt that the current "decoupling" thesis being promulgated by lots of fund managers could be another example of a post-Fed easing bubble being blown up. These bubbles often have extended lifetimes but the mania for some Asian and embryonic capital markets does seem unusually febrile at present.

I continue to be focused on the intriguing daily formations that are showing up on the chart for the Nasdaq 100 (^NDX). The risk/reward calculus for this index is beginning to look less attractive, which is only to say that the low hanging fruit in the immediate aftermath of the cut in the fed funds rate would appear to have been harvested.

In addition to the energy sector funds which are looking somewhat extended I would point again to the chart for XLP, consisting of stocks from the consumer staples area which is seeing strong volume activity and which may be about to roll over.

The homebuilders have enjoyed a bit of a bounce this week for both technical reasons and as a result of positive analyst comments. However the rally has to contend soon with the 50-day EMA which the sector has not traded above since early June and a rather clear downtrend line that should provide some stiff resistance.

TRADE OPPORTUNITIES/SETUPS FOR THURSDAY OCTOBER 4, 2007
The patterns identified below should be considered as indicative of eventual price direction in forthcoming trading sessions. None of these setups should be seen as specifically opportune for the current trading session.
Netflix (NFLX) has a small bull flag formation with the appropriate volume characteristics and the pullback has managed to remain above the 200-day EMA.

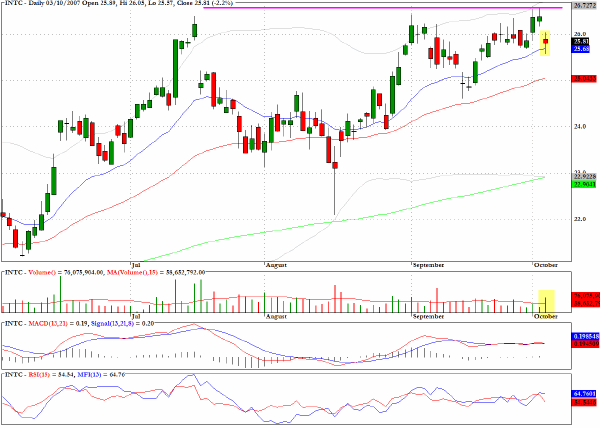
Intel (INTC) has turned round three times, over the last few months, in the vicinity of the $27 level and yesterday’s 2.2% drop on substantial volume may be pointing to the beginning of a tradable corrective period.

Clive Corcoran is the publisher of TradeWithForm.com, which provides daily analysis and commentary on the US stock market. He specializes in market neutral investing and and is currently working on a book about the benefits of trading with long/short strategies, which is scheduled for publication later this year.
Disclaimer
The purpose of this article is to offer you the chance to review the trading methodology, risk reduction strategies and portfolio construction techniques described at tradewithform.com. There is no guarantee that the trading strategies advocated will be profitable. Moreover, there is a risk that following these strategies will lead to loss of capital. Past results are no guarantee of future results. Trading stocks and CFD's can yield large rewards, but also has large potential risks. Trading with leverage can be especially risky. You should be fully aware of the risks of trading in the capital markets. You are strongly advised not to trade with capital.
|