| Corcoran Technical Trading Patterns for October 5 |
| By Clive Corcoran |
Published
10/5/2007
|
Stocks
|
Unrated
|
|
|
|
Corcoran Technical Trading Patterns for October 5
Subdued trading yesterday produced rather narrow range, often inside day patterns, as traders prepared themselves for the release of September’s employment data today.
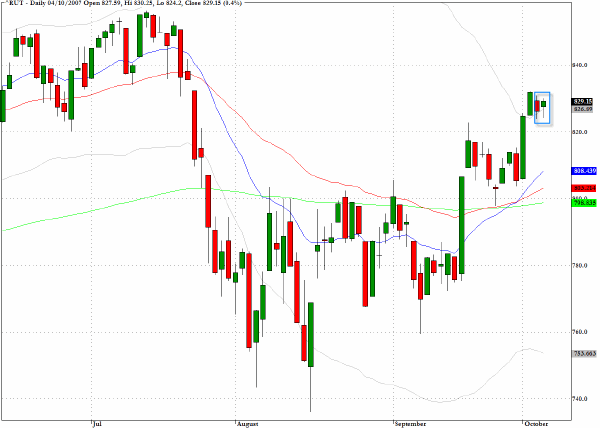
The Russell 2000 (^RUT) produced another small candlestick which was entirely within the range of Wednesday’s trading, itself a fairly narrow range. I shall be watching how this index behaves in the aftermath of the data to be released today, and a determined effort to establish new historic highs on this index would bode well for the overall market.
The European Central Bank and the Bank of England both left their key short-term rates on hold and once again the pundits will expend an enormous amount of effort today trying to analyze the nuances of the employment data and how this will impact on future Fed policy. Unless we get a very surprising number, either very strong or very weak, then there will be little to further clarify the likely outcome of the next FOMC meeting at the end of this month.
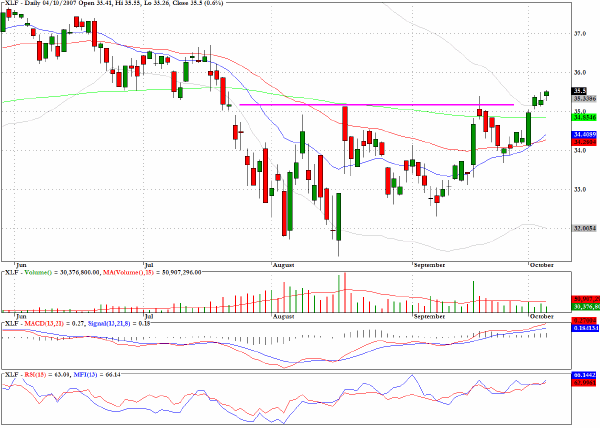
XLF, the exchange traded fund for the financial services sector, has gradually but surely now moved above the 200-day EMA and in a formation that looks as though it intends to continue moving further upward.
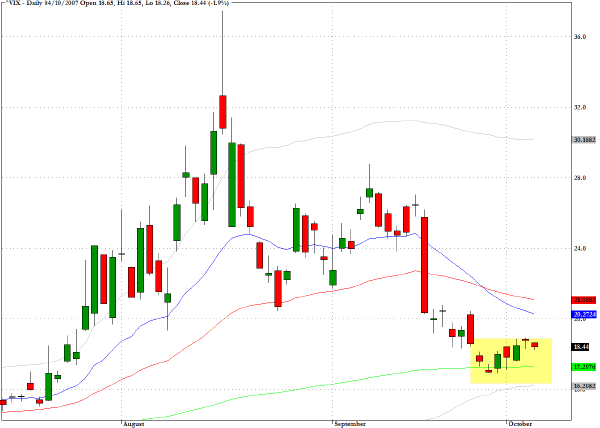
So far this week the market has not produced the intraday volatility that I was expecting. The CBOE Volatility (^VIX) has made small moves in recent sessions but interestingly the downward bias in late September appears to have stalled as the index reached the 200 day EMA.
TRADE OPPORTUNITIES/SETUPS FOR FRIDAY OCTOBER 5, 2007
The patterns identified below should be considered as indicative of eventual price direction in forthcoming trading sessions. None of these setups should be seen as specifically opportune for the current trading session.
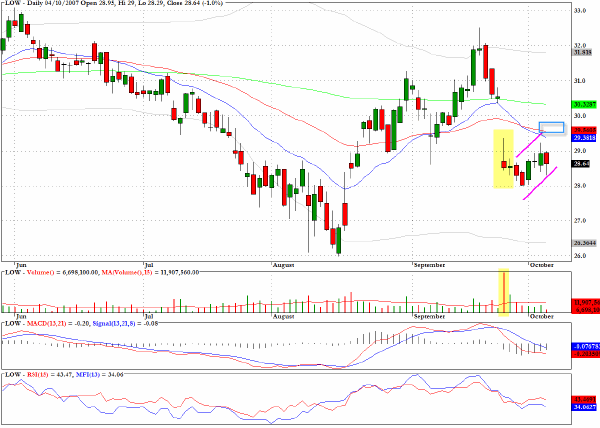
Lowe’s Companies (LOW) has spent several sessions pulling back from the steep drop down on very heavy volume that took place on September 25. A firm resistance level just above yesterday’s close at the convergence of two moving averages could be the threshold for further selling to emerge.
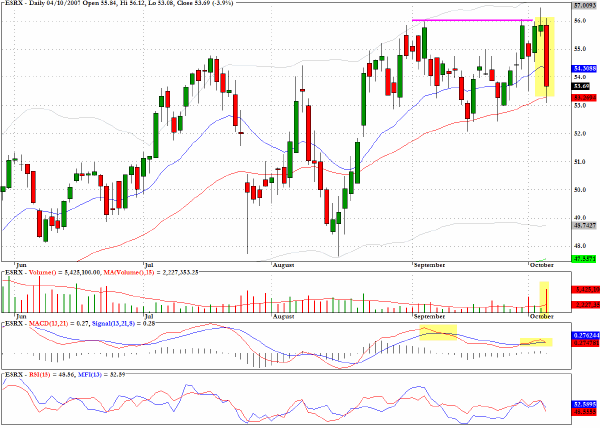
Express Scripts (ESRX) sold off on almost three times the average daily volume yesterday and the chart clearly shows a failure pattern at the $56 level. The MACD chart reveals a negative divergence that could have alerted us to the probable failure to break above the same price level that arrested the advance in early September.
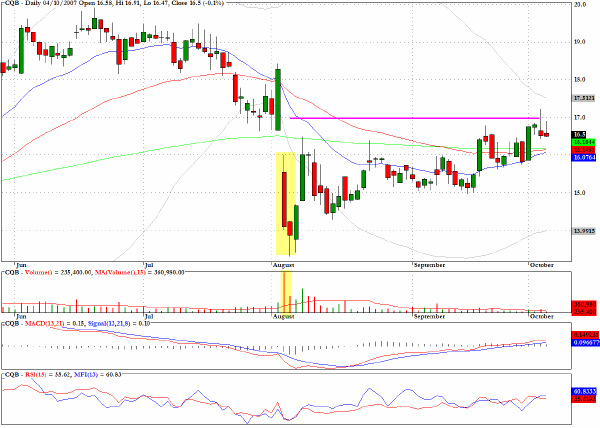
Chiquita Brands (CQB) has returned to a level around $17 from which the stock gapped down in early August.
Clive Corcoran is the publisher of TradeWithForm.com, which provides daily analysis and commentary on the US stock market. He specializes in market neutral investing and and is currently working on a book about the benefits of trading with long/short strategies, which is scheduled for publication later this year.
Disclaimer
The purpose of this article is to offer you the chance to review the trading methodology, risk reduction strategies and portfolio construction techniques described at tradewithform.com. There is no guarantee that the trading strategies advocated will be profitable. Moreover, there is a risk that following these strategies will lead to loss of capital. Past results are no guarantee of future results. Trading stocks and CFD's can yield large rewards, but also has large potential risks. Trading with leverage can be especially risky. You should be fully aware of the risks of trading in the capital markets. You are strongly advised not to trade with capital.
|