|
Collection of Trader Tools Improves Odds
As I was thinking about how and what I wanted to say with today's column, we got this question that pretty much summed it all up:
"The EPCR [equity-only put/call ratio] got me in so much trouble the last time, when it kept pushing against the upper band and even went over 100%. Why would a reading that is 50/50 be of concern? Couldn't the bears be washed away just as quickly as the bulls? It seems like even when the market is going down, there is no real momentum behind it."
I think there's a lot of potentially good information in the answer and explanation to the question. But first, let's just take a look at exactly what he's talking about.
Most of you know we're sentiment analysts, which just means we look for market reversal when investor opinions have gotten dangerously bullish, or ridiculously bearish. We're also contrarians, which means we're most bullish when everyone is bearish, and bearish when everyone else is bullish.
The put/call reading, just a ratio of how many bearish puts traded yesterday relative to bullish calls, does a pretty good job of telling us when things are out of whack and a reversal is likely to be near. When the EPCR (the equity put/call ratio) is very low, investors are bullish, perhaps too bullish, which means they'll be 'punished' with a dip. When they're terrified the EPCR is very high, that's frequently around market bottoms.
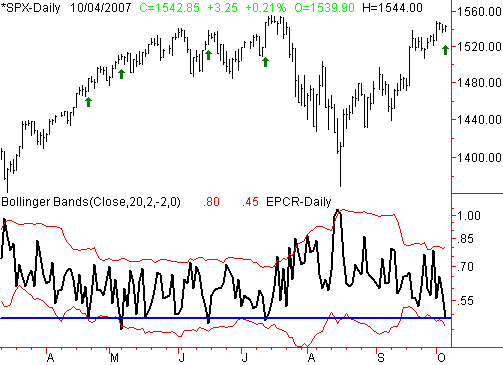
On the chart below, we've plotted the S&P 500 and the EPCR below. Around the EPCR we have 20-day Bollinger bands, plus a blue support line right around 50. Each of the last five times the EPCR hit the lower band, which is an extreme low reading, and/or the line at 50, we've marked with a green arrow. Though the jury is still out on Thursday's EPCR of 49%, three of the prior four instances did indeed occur right in front of decent-to-good pullbacks. Some were better than others, but that's not a bad success rate.
S&P 500 with EPCR - Daily

Now, just for the sake or argument, what were the buy signals - or peaks in fear - like? In this case, an encounter with the upper Bollinger band and/or a reading above 80 are historically good signs we're at or near a bottom. Those instances are marked by a red arrow.
Right away we can see there are a lot more of these signals than there are sell signals. That's been a more recent development - we didn't used to get quite that many. Nevertheless, basically seven of the last ten buy signals were good, as they came in front of surges or rallies of one degree or another, though most were admittedly small.
What the reader's question is pointed at is July's touches on the upper Bollinger band. Technically speaking, you could have justified three buy signals during that time. Each of which would have been wrong. The guy's right; the EPCR just kept pushing up and into the upper band, while stocks sank.
S&P 500 with EPCR - Daily

So, our answer is, that's one of the pitfalls of using this kind of tool. It's an odds game, and around that time, the odds didn't favor the traditional interpretation of the put/call reading. Overall though, we still believe in the EPCR, flaws and all. It spots looming reversals well before the market or indices hints at them.
Side note: The way the EPCR moves now is different than it was a few years ago; it now seems to be a little more volatile. In some ways we've adjusted for that, though the Bollinger bands tend to self-adjust. What's different now is the timeframe for trades. It used to be that EPCR-based trends could last for weeks. Now they clearly last for only days before the next EPCR signal (unless you can fall back to a weekly chart to weed out a lot of the extra noise we've been seeing for the last couple of years).
However, this brings up the actual point we wanted to make, even before we got the question.
We intentionally look at other tools. Specifically, we look at the VIX, and our own Rydex mutual fund ratio. By using a collection of tools, we can better identify anomalous readings or confusing charts. While a 'ruling by committee' approach can be dangerous, it can also suggest when action is not merited at all.
That being said, for the sake of total understanding, we want to show you our other two charts we use in conjunction with the EPCR.
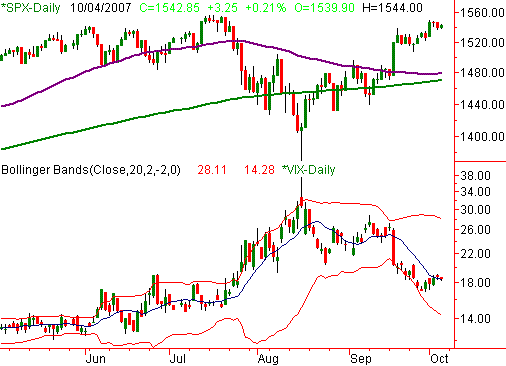
The CBOE Volatility Index (or VIX) is designed to move in the opposite direction of the EPCR, meaning low is bullish and high is bearish. Other than that, the interpretation is the same. On our chart below of the SPX and the VIX, one things sticks out to us. The VIX has been moving higher, which is bearish, lately, while stocks have drifted lower. An omen? Maybe. It's definitely a concern, but not one we can really get too worried about just yet. A lower close for stocks and a close above this week's high of 18.99 for the VIX would be bearish.
S&P 500 with VIX - Daily
3 
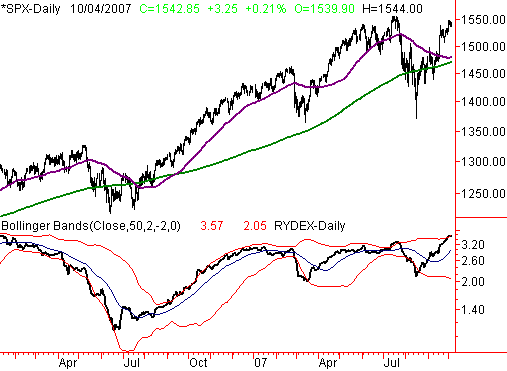
Our Rydex bull/bear fund ratio moves like the put/call reading does. It moves upward as things get more bullish. As you can see below, it too has hit an extreme level at the upper band and is no under attack. We may well end up repeating what we saw in the fall of 2006, where the Rydex ratio just pushed up and into the upper band for months on end. We haven't seen that yet though. The only thing we've seen is a pause at the upper band.
S&P 500 with Rydex ratio - Daily

Bottom line: We consider a variety of factors when making decisions. While they can still be wrong together, we believe our odds improve by watching multiple ideas, which can help spot errant or misleading information evident in one individual tool.
Also, you don't need me to tell you how vulnerable stocks got Thursday, now according to all three indicators. The bearish switch hasn't been flipped yet, but we're watching for it closely. That's the other downside to sentiment analysis; it may not tell you exactly when.
Price Headley is the founder and chief analyst of BigTrends.com.
|