|
Weekly Outlook in the Stock Market
NASDAQ Commentary
The NASDAQ flew on Friday, gaining 1.71% (46.75 points) to end the day at 2780.32. For the week, that meant a 2.91% gain, up 78.82 points. The result? Just new multi-year highs, that's all. Do we ride the trend? Great question. We said no last week, and look what happened. However, the big move has compounded the problem; now we're really overbought, with a big fat gap looming just below.
One of the semi-bearish arguments we've been making is a lack of volume behind the uptrend. Well, over the last couple of weeks, that factor has shifted. Look at the Chaikin line on the chart below. It's above zero, and still rising (a bullish sign). Yeah, it's shaky (meaning erratic), but there all the same. Momentum? Obviously to the upside.
NASDAQ Composite - Daily
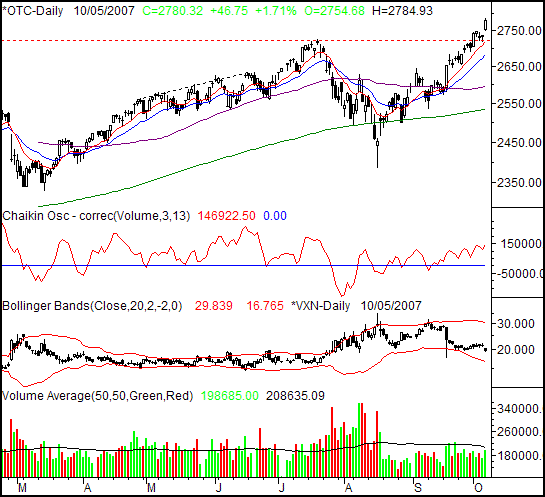
So we're bullish then? Not quite. On the daily chart, being overbought hasn't meant much in terms of being bearish. However, on Friday the VIX went from 'rising' to interesting. In the same way the NASDQ gapped higher, the VIX gapped lower, snapping what was shaping up to be an uptrend. It's still too soon to say if this is the VIX's (or the market's) new direction, but we have to wonder. On the flipside, gaps ache to be closed.
There's something else though, the weekly chart. We hadn't yet really hit an extreme high on the weekly chart, until last Friday's final hurrah. Now take a look at the two blue lines on the chart below (not the red ones; they're the older resistance lines). The thin blue line is the intermediate-term resistance line; the thick blue one is the long-term resistance line.
NASDAQ Composite - Daily
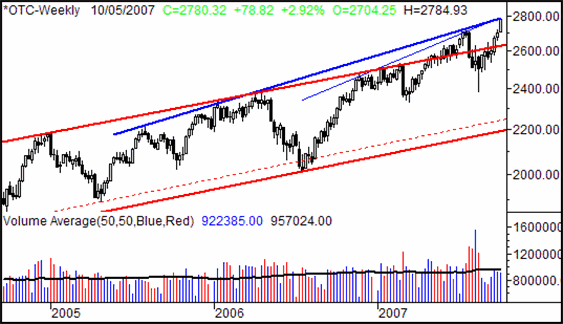
So, here's what we see; either we're finally at a serious top, or we're on the verge of one record-breaking rally (and we haven't ruled the latter one out yet). We'll draw the line in the sand at 2784.93, Friday's high. Don't misunderstand; it could take a few days to break through that ceiling. As long as we don't slip under the 20-day line at 2680, the bulls should remain in control. Obviously this presents something of a waiting game.
S&P 500 Commentary
The S&P 500 finally joined the Dow and the NASDAQ as a champion of new multi-year highs. Last week, the large cap index added 30.85 points, or 2.02%, to close out at 1557.60. A big chunk of that was thanks to Friday's 14.75 point, 0.96%, gain.
A bullish event? Allegedly, but we do want to point out one noteworthy failure in the 'buy new highs' theory. Go back about three months ago. The SPX hit new multi-year highs then, and then proceeded to give up about 10% of its value. We're just as overbought now as we were then. Yeah, we may get even a little higher before any pullback starts, if it starts. But, the risk profile of buying these new highs is pretty great. If this is indeed a bullish event, we'd still prefer to buy once any dip is over and done with. If said dip never actually turns around, then we can safely trade the other direction, as in July.
S&P 500 - Daily
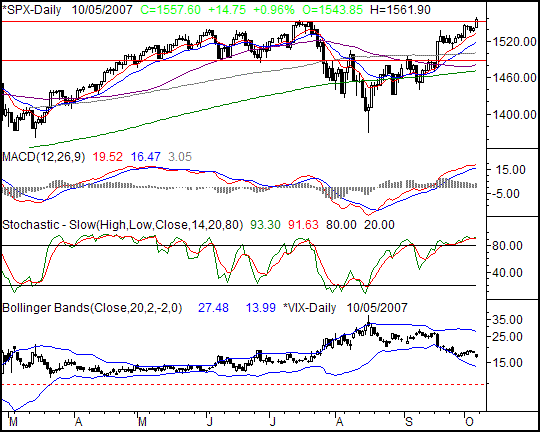
So, we have to assume bullishness based on the trend, but we think right now is a lousy time to buy; wait for a pullback and see what happens. If the S&P 500 slides under its 20-day line at 1520, then get concerned. However, it's worth noting there's a plethora of potential support in all of the moving averages between 1471 and 1534. As long as the 1471 area holds up, the dip shouldn't hurt too bad. A move under that line could mean more trouble.
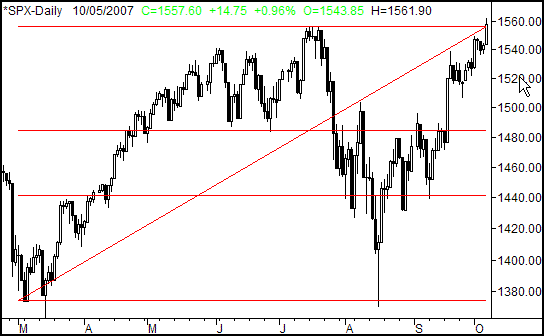
All that being said, we're not particularly thrilled with the use of moving averages as reversal points; it didn't work in August. In an effort to find alternative pullback targets, we're going to break out the Fibonacci lines again.
We're roughly using March's and August's lows as the baseline, since we basically found support at the same level in those months. For the top edge of the range, we're using July's and last week's peaks. Again, they're basically the same (it's never perfect - we have to use measures as close to meaningful levels as we can).
The lines speak for themselves; that first 38.2% retracement is at 1485. Ring a bell? It's right in the middle of all those moving averages. (Maybe we could have just been satisfied with the moving averages after all.)
S&P 500 - Daily, with Fibonacci lines
Dow Jones Industrials Commentary
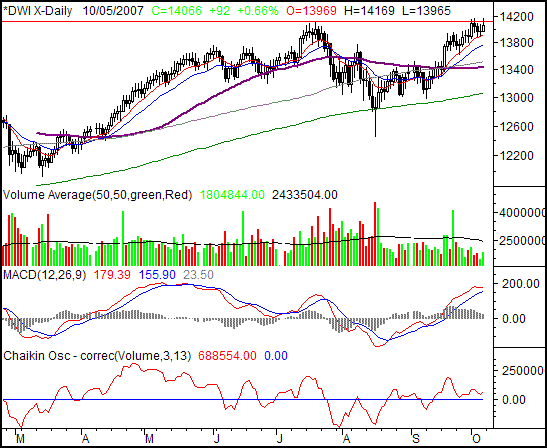
There's not a lot of room left for a Dow discussion this week, so we'll just hit the highlights. This blue chip index gained 92 points on Friday, or 0.66%. On a weekly basis, it gained 1.22%, or 170 points. And yes, it also hit new multi-year highs on Friday, but barely. It also hit them on Tuesday and Wednesday, but didn't do a very good job at holding onto them any of those days.
There are a couple of things we noticed in all of this data. The strength of the uptrend here is really starting to taper off, and the buying volume is as well. Maybe that's just rotation out of blue chips and into aggressive names. The results from last week certainly say that's a possibility (with the NASDAQ up big).
If the Dow can get and stay above 14,169, then the bulls may muster enough confidence to keep the uptrend alive. If instead the 20-day line at 13,778 doesn't hold up as support, well, don't worry about it actually. If it doesn't, the 50-, 100-, or 200-day lines could all end up doing the job anyway. So, we don't see too much downside here just yet.
Dow Jones Industrials Chart - Daily
Price Headley is the founder and chief analyst of BigTrends.com.
|