|
Industrials and Materials Set To Rotate
If being in the right sector is good, then being in the right industry is great. While it's been estimated that sector influence is responsible for between 30% and 50% of a stock's movement, we'd chalk most of that up to industry influence. With that, today we're again going to dive head-first into industries. That, after all, could end up making or saving you significantly more than a sector analysis could on its own. Once again we've broken out the percentage-change charts to show you how the undertows seem to be changing.
Industrials
The word industrial has a broad meaning for investors, but today we specifically mean industrials as the companies that make machines, operate factories, and ship heavy goods. Even within this sector, there are a surprisingly large number of segments.

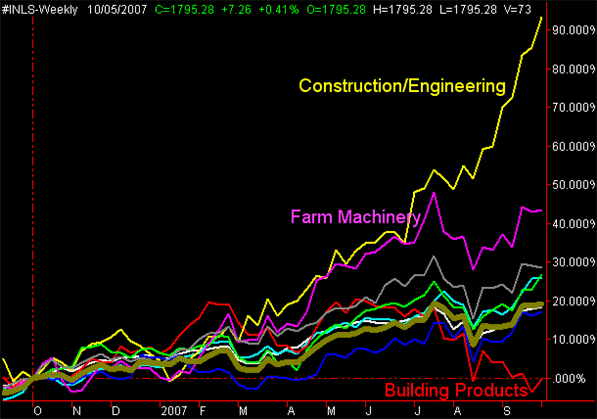
First things first though. The broad industrial sector's run is plotted with the thick greenish line -- up about 20% over the last twelve months. The red line - the only one in negative territory - is the building products industry's stocks. The heroic yellow line? That's construction and engineering, up more than 90% going back a year. The runner up (the hot pink line) is construction and farm machinery. Take a look, then keep reading for our take.
Do we jump on the current trends, good or bad? I like the construction and farm machinery uptrend, and think it could persist. The construction/engineering rally, though, I have my doubts about. Personally, I'd avoid it. It's very overbought. Building products, despite being the laggard, is interesting to me. It was actually one of the better performers last week. Why? It really shouldn't have been. But, if you like values, then I like your odds in that beaten-up arena.
Major construction/engineering stocks: Fluor (FLR), McDermott (MDR), Foster-Wheeler (FWLT)
Major construction and farm machinery stocks: Deere (DE), AGCO (AG), Terex (TEX)
Major building products stocks: Vulcan (VMC), Fastenal (FAST), Martin Marietta (MLM)
Basic Materials
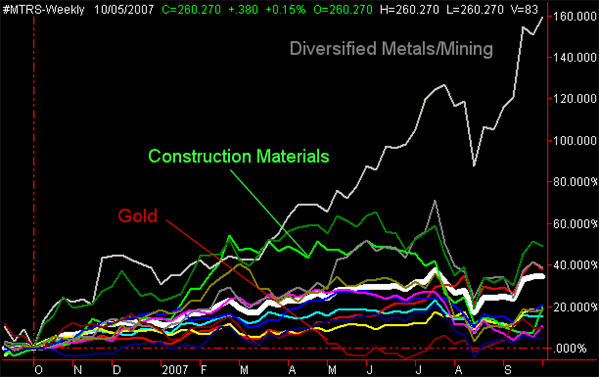
On the next chart, the broad basic materials sector appears with a thick white line, up about 35% over the last 52 weeks. Not bad, but that clearly pales in comparison to the diversified metals and mining group (grey) on our chart. These obscure guys are up about 160% or the last year.
You would have thought there's be some overlap there with another metal that's mostly mined out. The near-laggard for the past twelve months has been gold, the maroon line on our chart. How did miners do so well but gold stocks do so poorly? I have no idea. I think the disparity mostly has to do with pricing. In that light, it might explain what's going in with gold prices.
In any case, those very same gold stocks are now doing much better. Again, with renewed strength following a long-term downtrend, I like the idea of gold being an undervalued play.
So, basically I'm looking for rotation here; leaders to become laggards, and vice versa.
The only other comment I think that needs to be made here is the sudden revival of construction materials, the bright green line on the chart. It was last week's leader. Does it ring a bell? It seems to jive with the industrial analysis above, where building products perked up.

Major metal/mining stocks: Alcan (AL), Alcoa (AA), Freeport McMoRan (FCX)
Major gold stocks: Lihir Gold (LIHR), Barrick (ABX), Goldcorp (GG)
Major industrial metals/minerals stocks: BHP Billiton (BHP), Cameco (CCJ)
Utilities
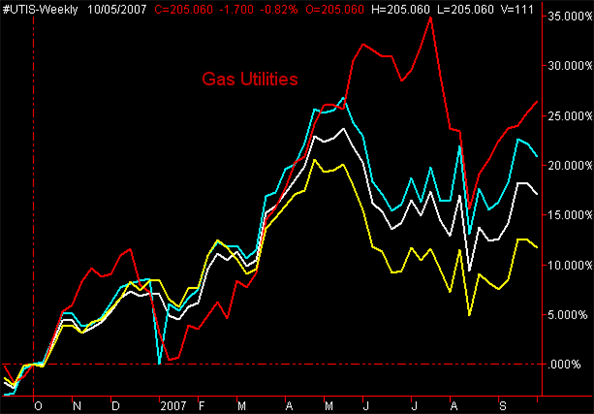
Finally, take a look at all the gas utilities (maroon) versus all the others. Though volatile, it's led most of the last twelve months, and was the first and best to rebound a few weeks ago. I think the gas utility stocks remain poised to outpace others in this group.

Major gas utility stocks: National Grid (NGG), Sempra (SRE), ONEOK (OKE).
Price Headley is the founder and chief analyst of BigTrends.com.
|