| The McMillan Options Strategist Weekly |
| By Lawrence G. McMillan |
Published
10/11/2007
|
Options
|
Unrated
|
|
|
|
The McMillan Options Strategist Weekly
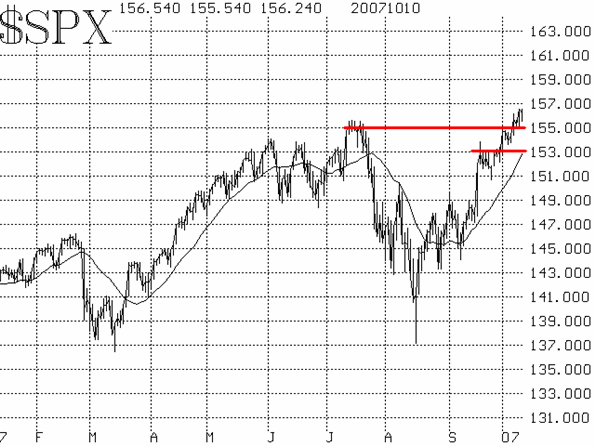
Last week's upside moves on Monday, October 1, and Friday, October 5, pushed most averages, including the S&P 500 ($SPX) to new all-time highs. Despite that bullish action, there were still some skeptics regarding the strength of the broad market. Such skeptics were likely under-invested fund managers who were hoping for a pullback to allow them to buy into the market.
The market is rarely so accommodating, though, and proved it by rocketing higher after a rather benign release of the FOMC meeting minutes on Tuesday of this week. Once the market started to move upwards on that news, the buyers jumped in and propelled it to yet another new all-time high. This is fairly standard action, which is usually caused by under-invested bulls rather than shorts having to cover (in our opinion, the shorts covered a while ago, to a large extent).

These buyers are desperate to show a high percent of money at work and so are anxious to spend their cash before the next reporting period (month-end October, most likely).
Technically, the small pullback on Monday would be the first support level for $SPX: the 1540-1550 area. Below that, the 1520-1530 area is support as well, although we don't expect to see that level tested soon.

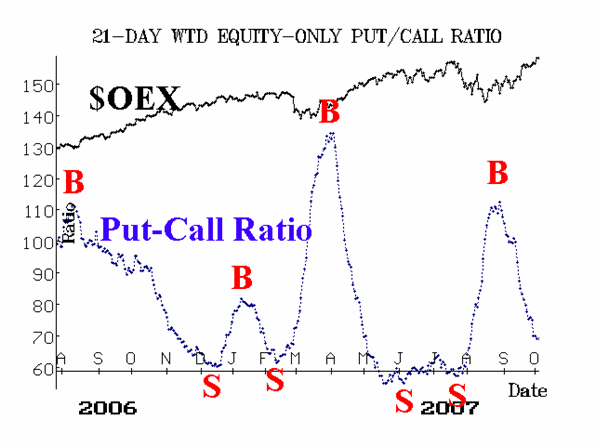
The equity-only put-call ratios continue to decline on their charts. That is intermediate-term bullish. Some might point out that they are nearing the bottom of their charts, and that is true. But, there is no reason why they can't go lower than the lows of the past two years. They often have in the past. We will remain bullish on this indicator unless it rolls over and begins to rise.
Market breadth (advances minus declines) has finally joined the party. Advances have completely dominated declines in recent weeks. As a result, it is constructive to see breadth register a severe overbought condition.

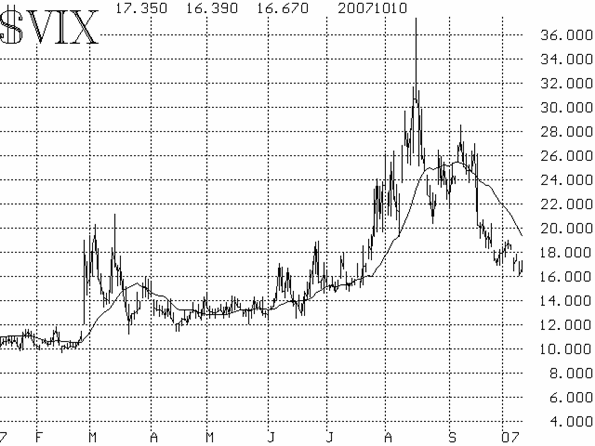
Volatility indices ($VIX and $VXO) have continued to decline, reaching their lowest levels since last July. A declining $VIX chart is bullish for the broad market, from an intermediate-term basis, and that's what we have now.

In summary, our indicators are still bullish -- especially from an intermediate-term viewpoint -- and thus we expect higher prices for the broad market.
Lawrence G. McMillan is the author of two best selling books on options, including Options as a Strategic Investment, recognized as essential resources for any serious option trader's library.
|