| Corcoran Technical Trading Patterns for October 12 |
| By Clive Corcoran |
Published
10/12/2007
|
Stocks
|
Unrated
|
|
|
|
Corcoran Technical Trading Patterns for October 12
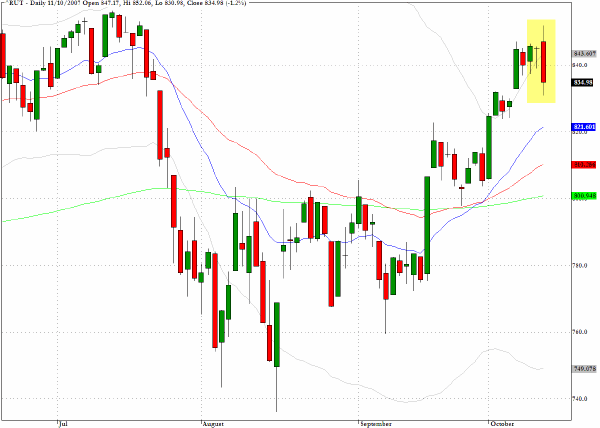
The markets succumbed to "profit taking" in the afternoon yesterday with much of the liquidation coming in some of the Nasdaq stocks as anticipated in yesterday’s commentary. The Russell 2000 (^RUT) followed the inside doji formation from Wednesday’s trading with a long red candlestick that attempted a move up towards the historic highs early in the session but along with the rest of the market the index dropped steadily into the close resulting in a 1.2% loss for the day.
Whether this was a one day correction or is something that could be more extended remains to be seen. Many charts are over-extended but that does not necessarily imply that the rather manic catch-up dynamics that have characterized recent trading will not reassert themselves soon. I shall also be watching the Asian markets, excluding Japan, for further signs that the euphoria which has powered the most bullish rally in twenty years and which led to new historic highs on several indices yesterday is peaking, or at least reaching a short term plateau.
Further weakness in the US markets could be one instigator, or concerns about the developing frothiness in markets in Bombay, Hong Kong, and Shanghai could be another instigator. Whichever it is, the net effect could be to bring on vertiginous anxiety among the large funds that are fuelling this emerging markets rally; and then the global markets, which have allegedly de-coupled according to the current rhetoric, may all start moving together again - downwards. I am not forecasting that this is imminent but simply suggesting that when it does occur, as it will, the sudden disappearance of liquidity will produce another high correlation event such as was seen in August.
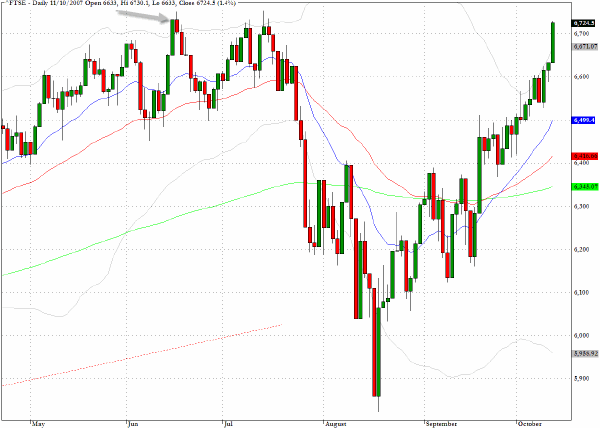
In yesterday’s trading the FTSE 100 (^FTSE) came within eight points of matching its previous historic high from June 15.
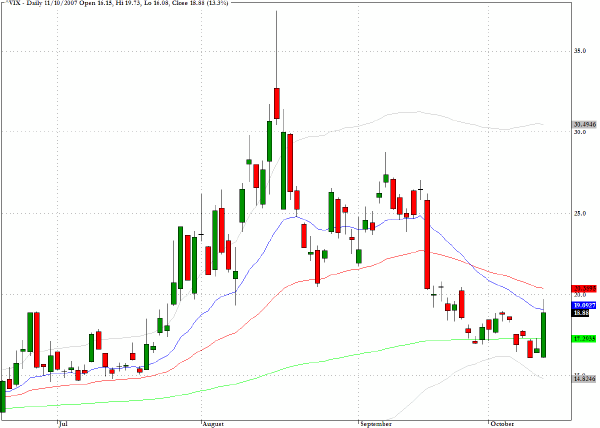
The CBOE Volatility Index (^VIX) produced its largest daily move yesterday since mid-September as it moved up by more than thirteen percent.
TRADE OPPORTUNITIES/SETUPS FOR FRIDAY OCTOBER 12, 2007
The patterns identified below should be considered as indicative of eventual price direction in forthcoming trading sessions. None of these setups should be seen as specifically opportune for the current trading session.
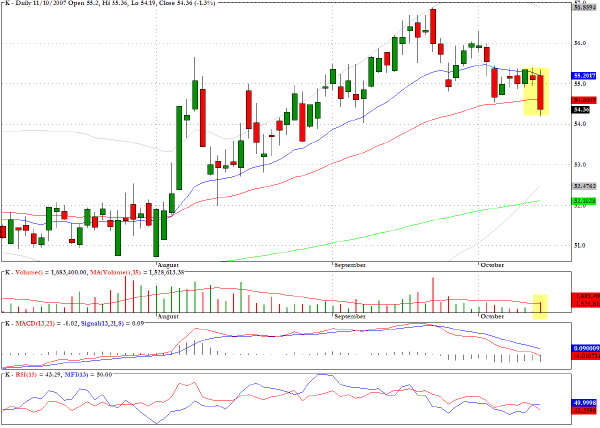
Kellogg (K) dropped below the bear flag formation that was discussed yesterday, and after closing below the 50-day EMA, looks as though it could be vulnerable to more downside.
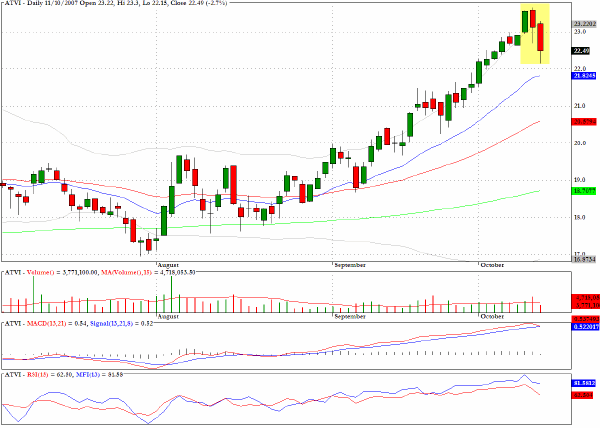
Activision (ATVI) registered an Evening star candlestick and could be tradable down to the $21 level.
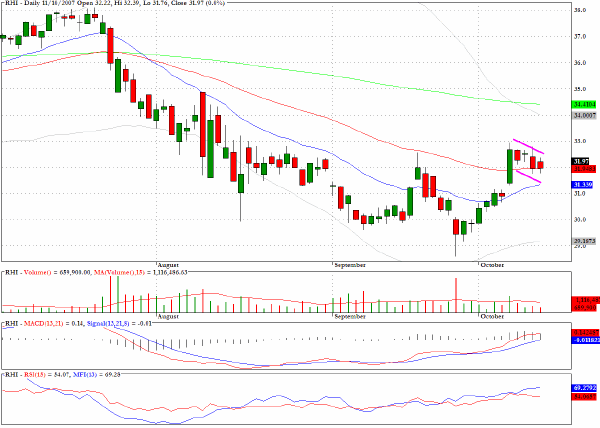
After moving decisively above the 50-day EMA last Friday on heavy volume, Robert Half International (RHI) has pulled back in a flag formation, and I still feel that the $35 level is an intermediate target.
Autodesk (ADSK) is one of many tech stocks that looks over-extended with an incipient correction emerging.

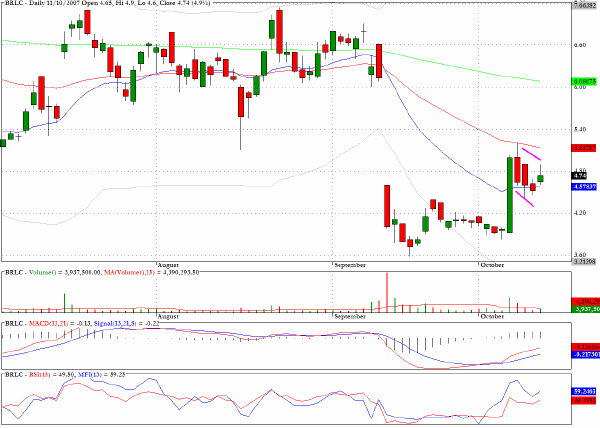
In a similar vein to the interpretation of RHI above, Syntax-Brillian Corporation (BRLC) has pulled back during this week since last Friday’s powerful surge and another leg up is to be expected.
Clive Corcoran is the publisher of TradeWithForm.com, which provides daily analysis and commentary on the US stock market. He specializes in market neutral investing and and is currently working on a book about the benefits of trading with long/short strategies, which is scheduled for publication later this year.
Disclaimer
The purpose of this article is to offer you the chance to review the trading methodology, risk reduction strategies and portfolio construction techniques described at tradewithform.com. There is no guarantee that the trading strategies advocated will be profitable. Moreover, there is a risk that following these strategies will lead to loss of capital. Past results are no guarantee of future results. Trading stocks and CFD's can yield large rewards, but also has large potential risks. Trading with leverage can be especially risky. You should be fully aware of the risks of trading in the capital markets. You are strongly advised not to trade with capital.
|