|
Weekly Outlook in the Stock Market
NASDAQ
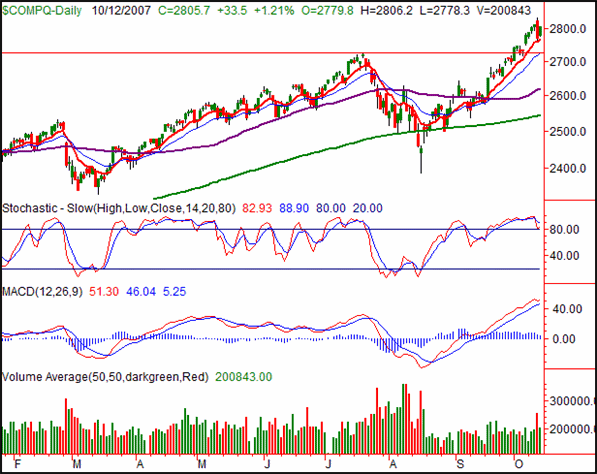
The NASDAQ rebounded by a hefty 1.21% on Friday, rising 33.5 points to end the day at 2805.7. That gain was the only reason the index closed in the black for the week, up 0.91%, or +25.4 points. The quick recovery is nothing to blow off, but neither is the major pullback we saw on Thursday. Trapped in the middle? Yep. The coming week is going to be interesting, and critical.
The only thing we want to point out specifically about the NASDAQ is that as of Friday, the NASDAQ is 10.2% above its 200-day moving average line (green). It was a few months ago we started looking at this alternative form of spotting overbought markets. And, it's worked pretty well (though not without some faults). All the same, bear in mind that in July, the NASDAQ crashed when it got 10.1% above the 200-day line. Everything has a limit. We're not saying 10.2% is the NASDAQ's ceiling, but it's a legitimate worry, especially when other indicators aren't raising many red flags.
Nevertheless, the more immediate hurdle for the bears is the 10-day average (red) at 2769. If it holds up again like it did on Thursday, it could buy enough time for the bulls to regroup. And, we don't technically have any sell signals yet, not MACD, nor stochastics.
It would be an uncanny rally though. We still contend the more likely scenario is a pullback, maybe to the 200-day line again (green) - now at 2545 - before we start the Q4 party. The other possibility is a repeat of last calendar year. You may recall the fall/Q3 was great, and Q4 just kind of fizzled. Either of those possibilities appears more plausible.
NASDAQ Composite - Daily Chart

S&P 500
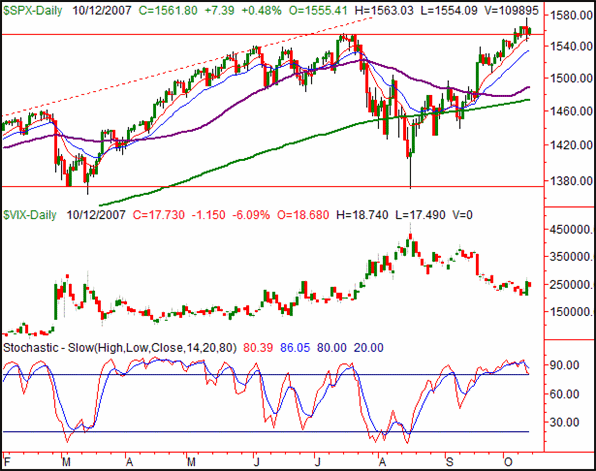
The S&P 500 saw a modest gain of 7.39 points on Friday, up 0.48% to close out at 1561.80. On a weekly basis the index closed up by 4.21 points, or 0.27%. A victory? Yes, but not one without major concerns. The pace is slowing, and Thursday's major outside reversal bar verifies the market's vulnerability.
A quick reality check: did you know the S&P 500 made a bigger gain between now and August's low than it did between March's bottom and July's high? And, it did it much faster.
Can stocks really justify such a rapid appreciation? It's going to take a heck of a lot more than another 1/4 point rate cut for this to make sense. It looks like investors are starting to agree. Thursday was bad, and for no real reason other than it was time. Profits are there, itching to be taken. All they need is a nudge. Thursday looked like that very nudge, and even though Friday eased the pain, it didn't erase all of it. Sometimes it takes two or three tries to get an avalanche going.
As for a downside target, we're still going to use the 50/200-day lines as the likely landing spot. That's somewhere around 1481, but it will be 1485 by the time it might happen. Look for the purple and green moving averages on the chart.
The VIX? Forget about it, at least for now. It got rocked last week, and really isn't telling us much of anything yet.
S&P 500 - Daily Chart

Dow Jones Industrial Average
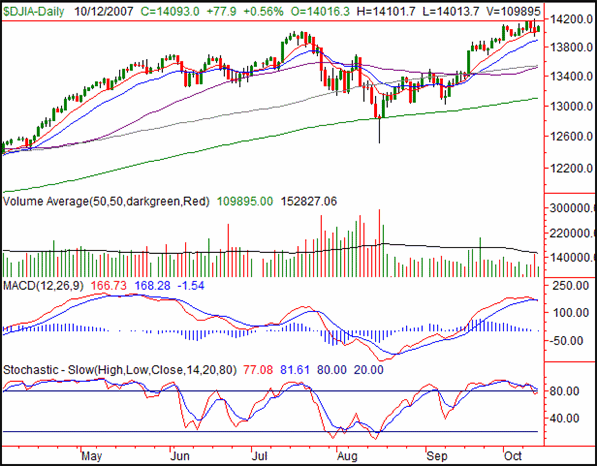
Thanks to a 77.9 point, 0.56% gain on Friday, the Dow Jones Industrials ended the day at 14,093.0. That was 27 points above the previous week's close, or +0.19%. Like the SPX, the Dow also hit new all-time highs last week. But, like the SPX , the enthusiasm behind the gains has changed.
Despite the gains, we actually have sell signals on the Dow, not a particularly encouraging sign considering they're blue chips. The official sell signals are from the MACD lines, with a crossunder, and the stochastic lines, almost. The stochastic sell signal will be complete when the %D line (blue) falls back under 80. Any weakness at all on Monday should finish it off.
However, we have to give credit where it's due. The 10-day moving average line stepped in as support on Thursday and Friday. It's at 14,002 right now, and if it doesn't break, all the bearish signals in the world won't matter.
There's another item on this chart that sticks out like a sore thumb, a serious lack of volume. Even though stocks have rallied sharply since August, never has volume been healthy here. That leads us to wonder just how much longevity can be left. The 'busy' period for stocks should have already begun, but we see very little participation this time around. Maybe we need one more blowout to pull 'em all back real nicely. Then we can start to work on the usual Q4 rally, starting with good values.
How far must we fall? A dip to the 200-day average (green) at 13,100 would be healthy. See August's low for proof.
Yes, a break past 14,167 would technically be bullish, but we're still on borrowed time here.
Dow Jones Industrial Average - Daily Chart

Price Headley is the founder and chief analyst of BigTrends.com.
|