| Corcoran Technical Trading Patterns for October 18 |
| By Clive Corcoran |
Published
10/18/2007
|
Stocks
|
Unrated
|
|
|
|
Corcoran Technical Trading Patterns for October 18
Yesterday’s trading highlighted the jittery and fragile nature of current market sentiment as an early rally predicated on good earnings from several large cap stocks was followed by a quick drop as concerns rose to the fore again about a deteriorating housing situation, credit market issues, a slowing economy and an exodus by foreigners from the US capital markets.
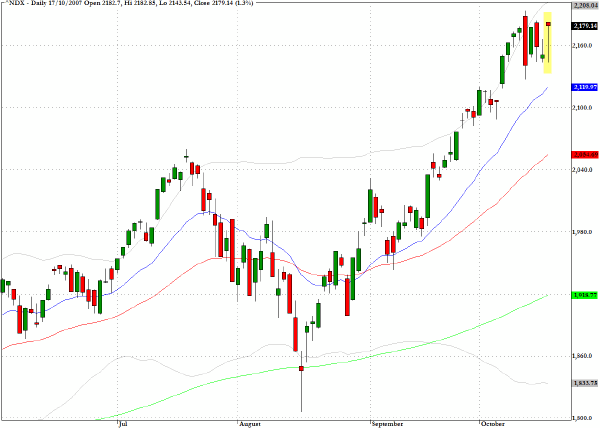
The market recovered into the close, but a common chart pattern from the day is seen in the chart for the Nasdaq 100 index (^NDX) which recorded a rather striking candlestick known as a hanging man, which is often seen near important highs when market conditions are nervous and unsettled.
As I am writing this the Bombay Sensex (^BSESN) concluded a volatile session with an almost four percent drop after yesterday’s gyrations, which included a halt to trading as the index plunged on the open after a government announcement that expressed concerns about the recent boom in this market. The government calmed nerves later in the session and the index regained its composure. There is undoubtedly a bullish case to be made for Indian equities but if hedge funds lose their nerve in the near term based on adverse developments in other global assets, a pause in the appetite for emerging market securities, even if short lived, could produce a lot more disruptive trading in Mumbai.
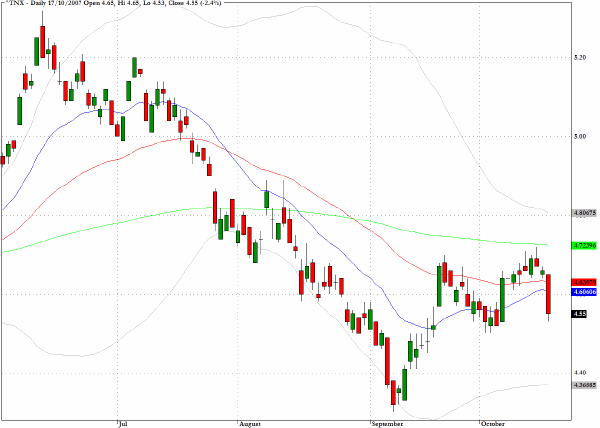
Yields fell across the spectrum of Treasury instruments and the yield on the ten-year note declined by eleven basis points. A retreat to the 4.4% level could be on the cards but traders have to weigh up their competing views regarding the evidence of a slowdown in the US economy and a more benign view of inflation with less supportive factors such as record prices for crude oil and some evidence of a global shift away from US denominated assets.
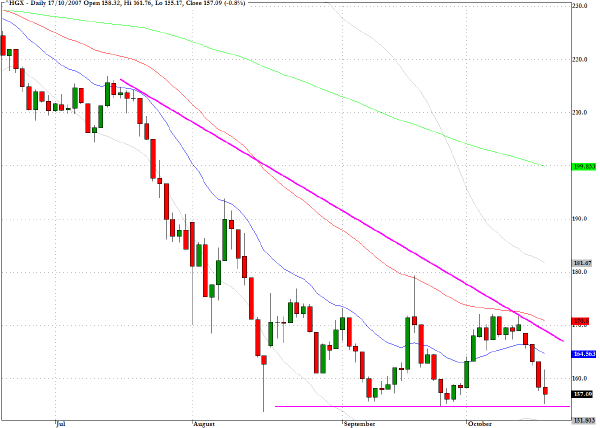
The housing index (^HGX) has declined towards the lows of the year in the wake of some grim news about housing starts and a precipitous drop in home sales in southern California. The larger pattern shows a descending wedge formation which can often point to even lower prices ahead.
TRADE OPPORTUNITIES/SETUPS FOR THURSDAY OCTOBER 18, 2007
The patterns identified below should be considered as indicative of eventual price direction in forthcoming trading sessions. None of these setups should be seen as specifically opportune for the current trading session.
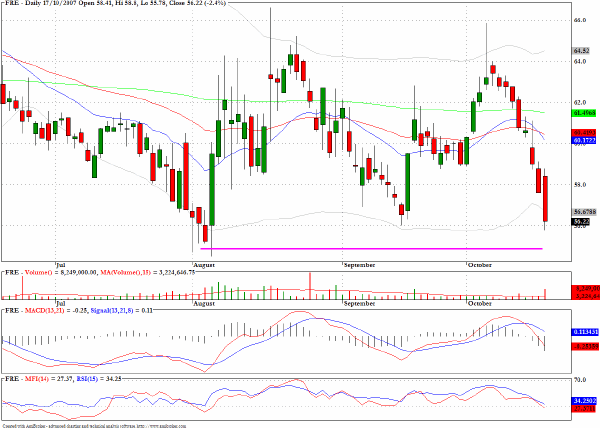
Freddie Mac (FRE) has retreated towards the 2007 lows and close to where the stock traded in July 2006. Some institutions may be tempted to bargain hunt at or near current levels.
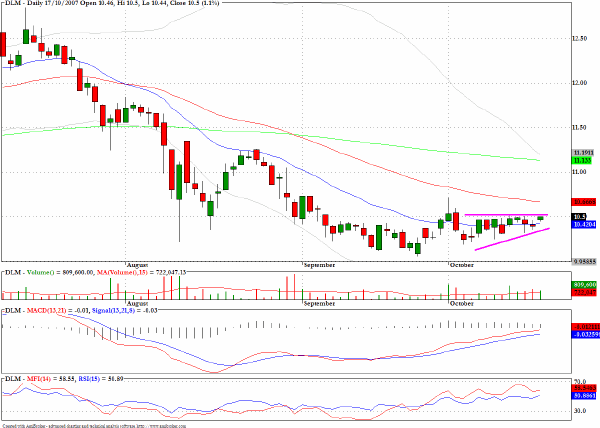
Del Monte Foods (DLM) has a constructive-looking wedge pattern and could be emerging from a basing pattern.
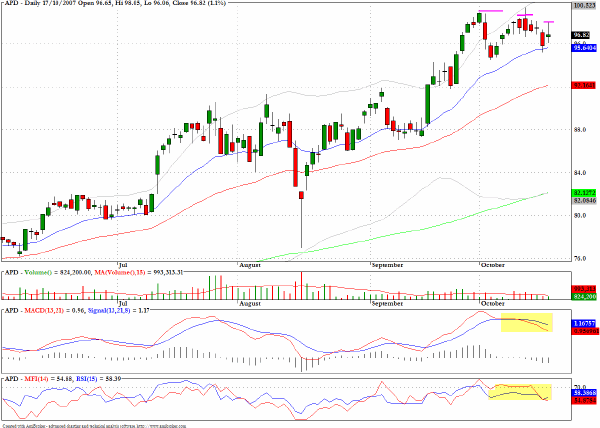
Air Products and Chemicals (APD) appears to be registering successively lower highs at the top of the recent range.
Clive Corcoran is the publisher of TradeWithForm.com, which provides daily analysis and commentary on the US stock market. He specializes in market neutral investing and and is currently working on a book about the benefits of trading with long/short strategies, which is scheduled for publication later this year.
Disclaimer
The purpose of this article is to offer you the chance to review the trading methodology, risk reduction strategies and portfolio construction techniques described at tradewithform.com. There is no guarantee that the trading strategies advocated will be profitable. Moreover, there is a risk that following these strategies will lead to loss of capital. Past results are no guarantee of future results. Trading stocks and CFD's can yield large rewards, but also has large potential risks. Trading with leverage can be especially risky. You should be fully aware of the risks of trading in the capital markets. You are strongly advised not to trade with capital.
|