The stock market has had something of a rough week this week despite the fact that it's October expiration week. The Dow has been down for 4 days in a row, although small-cap indices have fared better. The question that arises is, "Is this a mere correction to work off an overbought condition, or is this market out of gas and due for another relatively large decline?" As always, we'll refer to our technical indicators to try to answer this question.

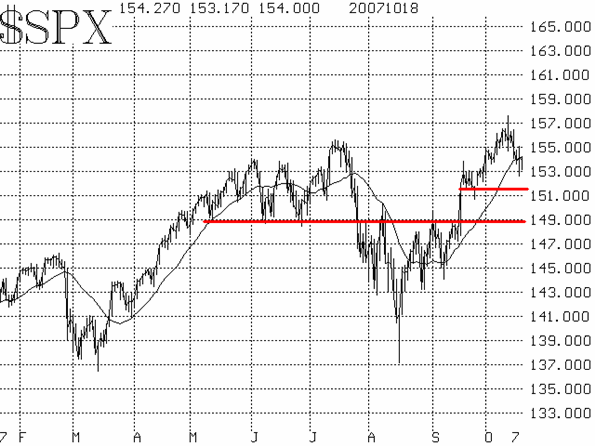
First of all, the $SPX chart remains bullish. There are several support levels on the chart. The most prominent of them is the 1540-550 area, an area which has still not been violated on a closing price basis by $SPX this week. Intraday, the averages dropped into the1520-1530 area yesterday, but rebounded strongly after doing so. While we would not be encouraged to see a violation on the downside of the 1520 area, there is another strong support area beneath there, at1490. But for bullish purposes, $SPX needs to stay above 1520.

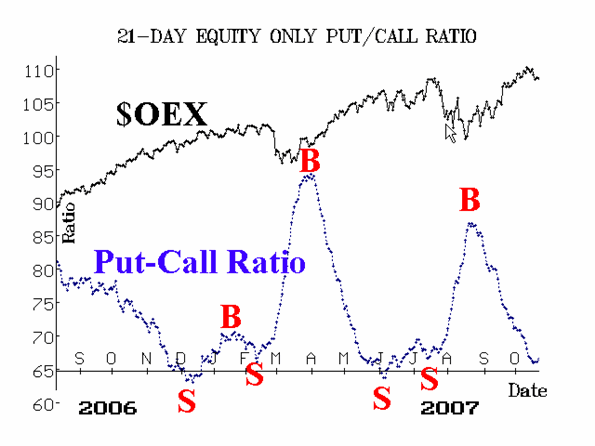
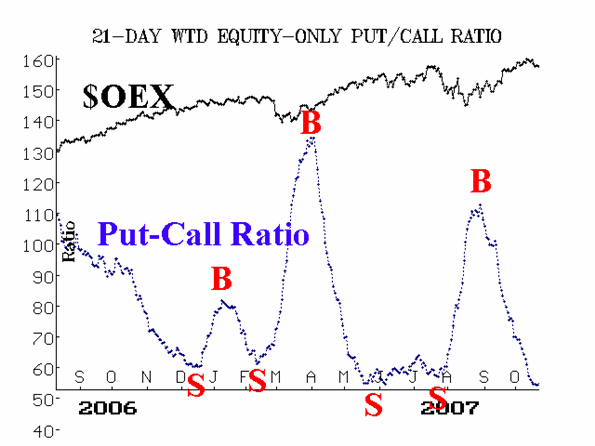
The equity-only put-call ratios remain bullish in that they continue to decline on their charts. But they are certainly at the bottom of their recent ranges. However, they have a small "curl" in them now, which is not yet a sell signal, but if they roll over and begin to rise, they would turn bearish.

The shorter-term indicators are more of a problem. Breadth (advances minus declines) has weakened considerably in the last week. While we don't consider breadth to be a leading indicator, preferring it to be a confirming indicator, this is still a short-term negative for the broad market.
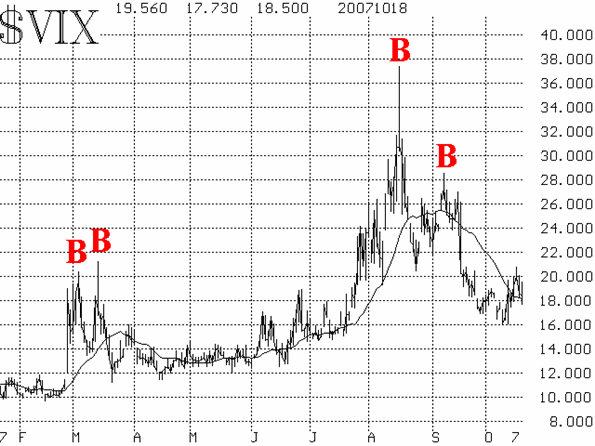
The volatility indices ($VIX and $VXO) have crept higher this week and have risen above their 20-day moving averages. Thus, the bullish downtrend of these indices has ceased. That places them in a type of neutral status. However, if a true uptrend develops in $VIX, then that would be bearish.

In summary, the market is in somewhat of a tenuous position right now. The bulls still have a chance to take charge, but if there is much further deterioration, they may lose control. At this point, we are still giving the benefit of the doubt to the bulls because of the intermediate-term buy signals that were registered in August and September, but if $SPX slips below 1520, and especially if it falls below 1490, the bears would be back in control once again.
Lawrence G. McMillan is the author of two best selling books on options, including Options as a Strategic Investment, recognized as essential resources for any serious option trader's library.