|
Weekly Outlook in the Stock Market
NASDAQ Composite
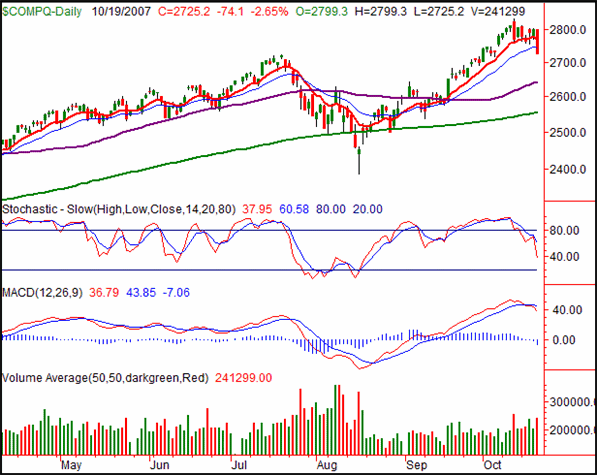
In what was the worst day in a long time on Friday, the NASDAQ tumbled a hefty 74.1 points, or -2.65%. On a weekly basis though, it only closed 80.5 points (-2.87%) lower, meaning most all of the loss came on the last day of the week. All the same, the first close under the 20-day average since September 10 doesn't bode well; we're seeing flashbacks of July.
The higher you fly, the farther you fall. It's just an idea we're reminded of when we compare the NASDAQ to the other indices. The composite has been leading in a big way, but getting so over-extended that it's a huge liability. That's why last week was such a problem; we're seeing sell signals we haven't seen for the NASDAQ since July.
Specifically, we have a MACD crossunder and a stochastic sell signal.
What we don't have - and this is why we see so much bearish potential here - is support anywhere close to where we are now. The 10- and 20-day lines were doing that, but they were broken last week. The next likely place the NASDAQ could find support as the 50-day average (purple) at 2642, 83 points away. Will we make a beeline for that mark? Doubtful, but there's been a lot of damage done now. Even with last week's carnage, the index is still quite a bit overbought. A fall all the way to the 200-day line (green) at 2554 is a realistic possibility.
Just for reference, the NASDAQ is now 3.8% below its recent peak of 2834. The July slide (from top to bottom) spanned 12.4%.
NASDAQ Composite Chart - Daily

S&P 500
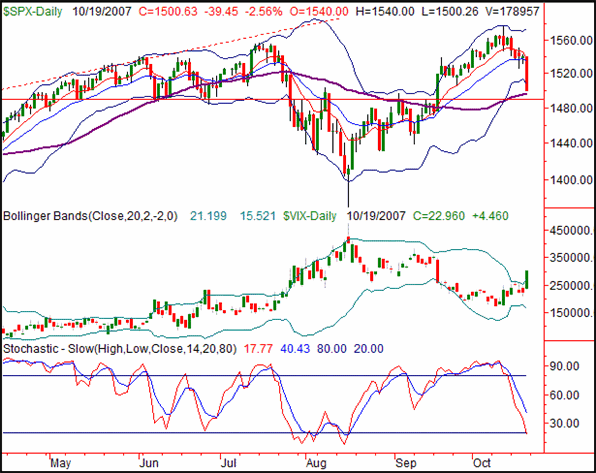
The S&P 500 fell 39.45 points on Friday, a 2.56% loss that left the index at 1500.63. That meant a 61.17 points loss (-3.92%) for the week. Bad? Yes, but it could get much worse for the bulls (though better for the bears) before it's all said and done.
Notice what happened at the lower Bollinger band on Friday. The SPX didn't find support there, but rather fell under it. That's unlike the support role it played on June 7 and June 27, but much like the failure to provide support we saw on July 26. In that instance, the lower band line was just a tour guide to lower lows.
That being said, there are two support possibilities for the S&P 500. The first is around 1490 (red horizontal line), where we found support a few times earlier in the year. The other is the 50-day average (purple) at 1497. Only being a few points under where we are now, it may be worth the wait to see what happens there. Or....
There may be a good possibility of a short-term bounce after Friday's decimation. If we do get that, we're looking for a full retest of the 10- and 20-day average (red and blue) around 1535. If we touch those lines again but can't get above them, that may be a nice short-term high in which short/bearish positions could be taken. The safer bearish play, as we said, would be waiting for a move below 1490. You just sacrifice about 40 points worth of potential downward movement by doing so.
They say the 'average' healthy correction is a dip of 10%. In July, the selloff was ultimately a 9.0% pullback. So far, we've only fallen back by 4.8%. A 10% dip would put the index at 1418.5.
S&P 500 Chart - Daily

Dow Jones Industrial Average
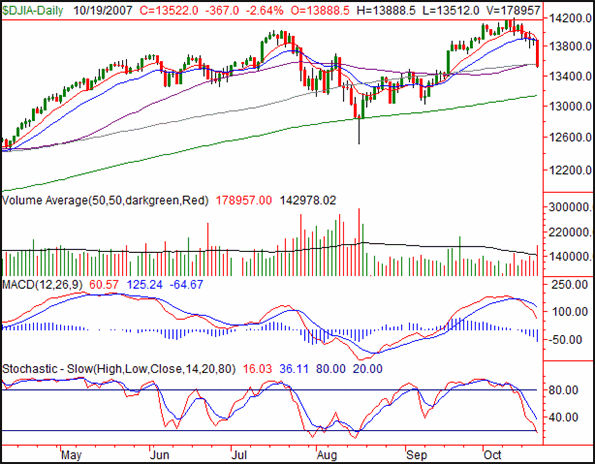
The Dow did about as poorly as any other index did on Friday, losing 367 points, or 2.64%. For the week it fell 571 points (-4.05%), closing out at 13,522.0. More than that though, it closed under its 50- and 100-day moving averages, not exactly a bullish event.
On the chart below, the 50- and 100-day lines are purple and gray, respectively. They're the ones the Dow just closed a hair under on Friday. We interpret this as a bearish/sell signal, but are also reminded of what happened back on August 3. On that day, we closed under the 100-day line, bounced (sharply) the next day, and for a couple days after that that. All looked well again, then the index made one final-but-big move lower, well under the 100-day average.
The point here is not to get too excited if we jump up again. After a terrible day and terrible week, we may be due for a dead-cat bounce. Realistically, we could give the 10- and 20-day averages (red and blue) one last retest. They're around 13,880 right now, so unless we actually get back above there, we're not really able to think bullishly. In fact, if we retest and stall there, we're going to assume an even bigger dip is on the way.
The likely bottom for all of this is the 200-day average (green), at 13,137.
Dow Jones Industrial Average Chart - Daily

Price Headley is the founder and chief analyst of BigTrends.com.
|