| Corcoran Technical Trading Patterns for October 22 |
| By Clive Corcoran |
Published
10/22/2007
|
Stocks
|
Unrated
|
|
|
|
Corcoran Technical Trading Patterns for October 22
The intuition on Friday that the market had reached an inflection point at which a strong directional move was imminent turned out to be more prescient than I thought. The equity market found that it had run out of cover in the face of continued adversity in sections of the money markets, burgeoning energy prices, and weakness in the dollar; and the catalyst for the bears to run amok was Caterpillar’s downbeat earnings statement and forecast. The company’s ominous assessment of economic prospects proved too hard a knock for the Dr Panglossian spin machine and caused a lot of analysts and fund managers to see a half empty glass that had previously appeared to be half full.
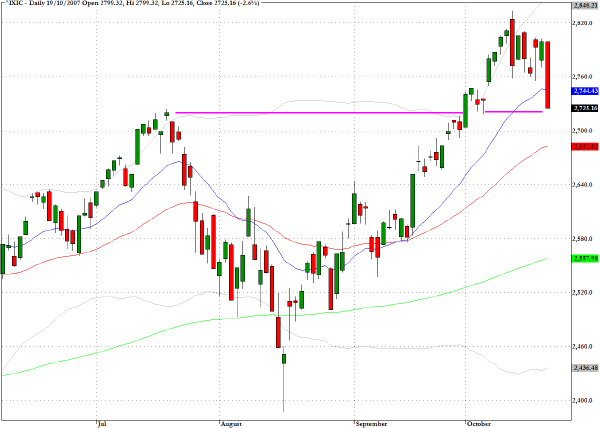
The Nasdaq Composite (^IXIC) took a 2.6 percent hit which was in line with the subset index of the Nasdaq 100 (^NDX) but as the charts reveal the larger composite index has now retreated back towards a retesting of the breakout at 2705 that occurred on October 1.
The reaction in the overseas markets to Friday’s action in the US has been rather heterogeneous with the Hang Seng (^HSI) in Hong Kong feeling most of the pain with a 3.6% decline, but the Bombay Sensex (^BSESN) ended Monday’s trading with a minor gain. European markets are holding with one percent losses as this is being written, which suggests that some traders may be taking the view that Friday’s action on Wall Street may have been a bit overdone.
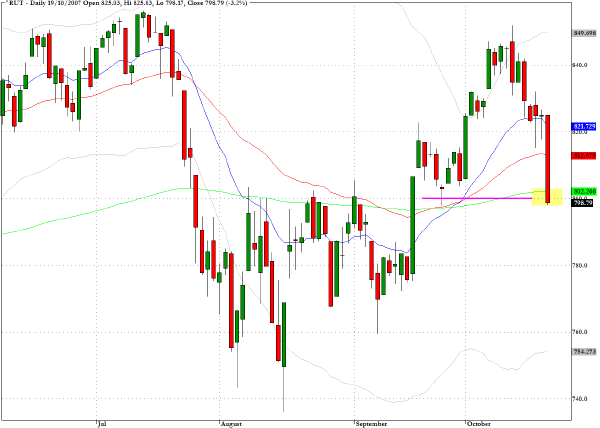
The Russell 2000 (^RUT), which experienced a more than three percent decline on Friday and five percent for the whole of last week, came to rest just below the pivotal level of 800. This level has provided both strong support and resistance over recent months and I shall be watching keenly to see if we can hold at or close to this level. If we cannot find a sustainable support near 800, then I would have to become much less sanguine about the intermediate outlook for equities, despite favorable seasonal factors. In terms of the larger picture it is also worth citing the fact that this index, unlike most other broad equity indices, failed to reach a new multi-period high during the rally off the August lows.
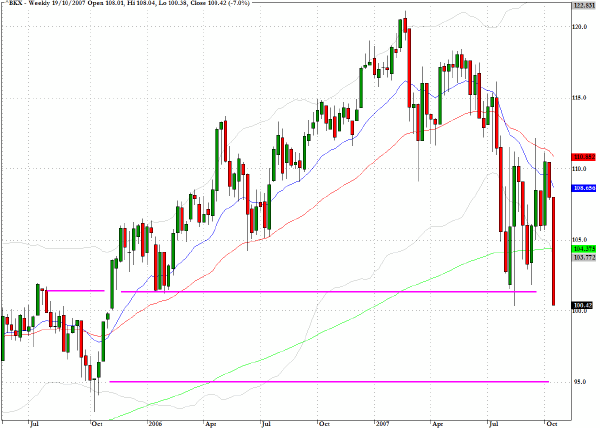
The weekly chart of the banking index (^BKX) shows that the early 2006 lows have now been taken out in addition to the 2007 lows. We may need to return to the October 2005 low, close to the 95 level, before the sector attracts some bargain hunters.
TRADE OPPORTUNITIES/SETUPS FOR MONDAY OCTOBER 22, 2007
The patterns identified below should be considered as indicative of eventual price direction in forthcoming trading sessions. None of these setups should be seen as specifically opportune for the current trading session.
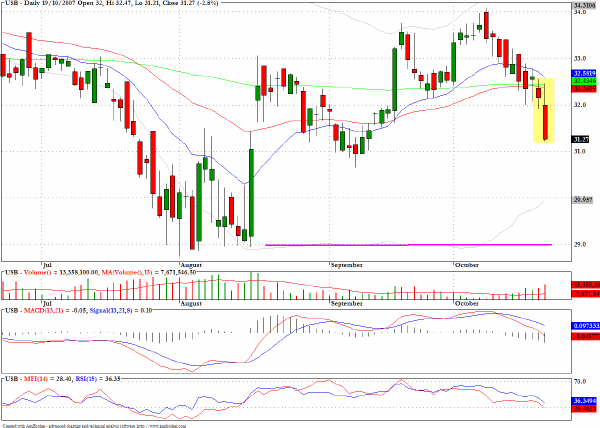
US Bancorp (USB) dropped below key moving averages in Friday’s sell off and the chart suggests that a revisit to the August low seems probable.
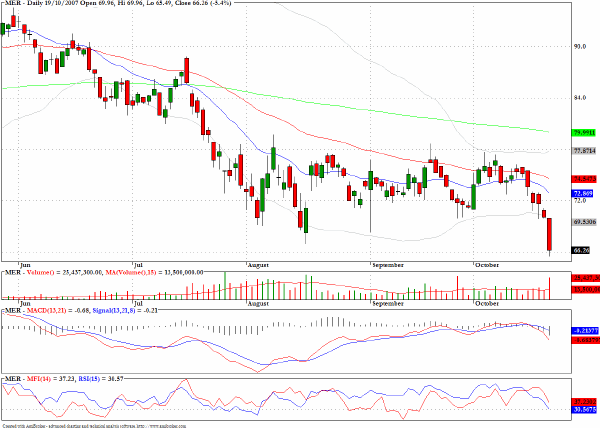
Merrill Lynch (MER) closed below the summer lows and has headed back towards the June, 2006 low below $66. As with the banking sector index that we reviewed above, there could be further attrition as the stock may need to seek out support closer to the October, 2005 levels just below $60.
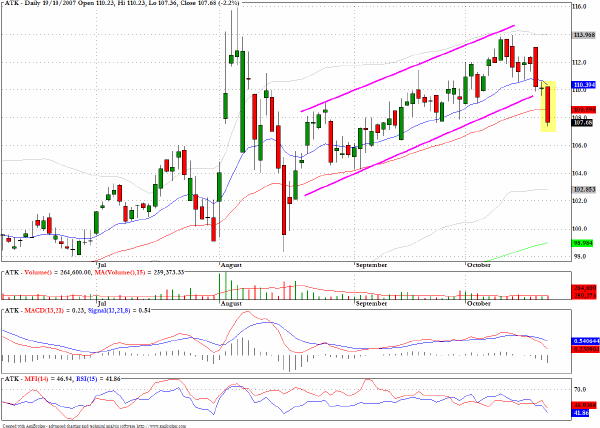
Alliant Tech Systems (ATK) has dropped below a clearly defined buy channel and also dropped below the 50-day EMA. The larger time frame reveals an extended pullback from the August selling. Perhaps not altogether a positive sign is that Friday’s volume was not particularly aggressive.
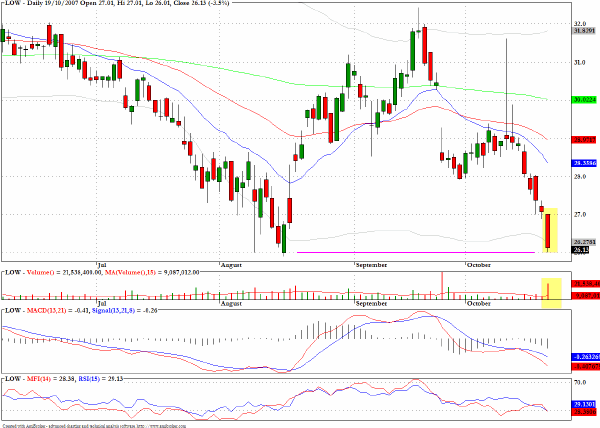
In last Tuesday’s commentary I suggested that Lowe’s Companies (LOW), which broke down from a bear flag pullback pattern, may not find real support until the mid August low near $26 is tested. In Friday’s sell off the stock reached almost exactly to that level and the trade would have delivered a seven percent return in four days.
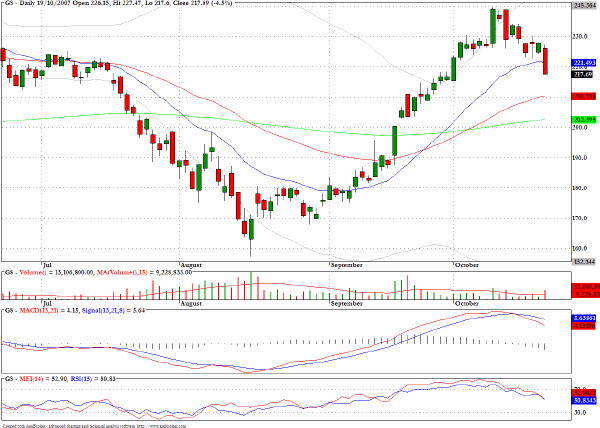
I would be surprised to see Goldman Sachs trade much below $210 again in the near term unless, of course, the correction gets quite nasty.
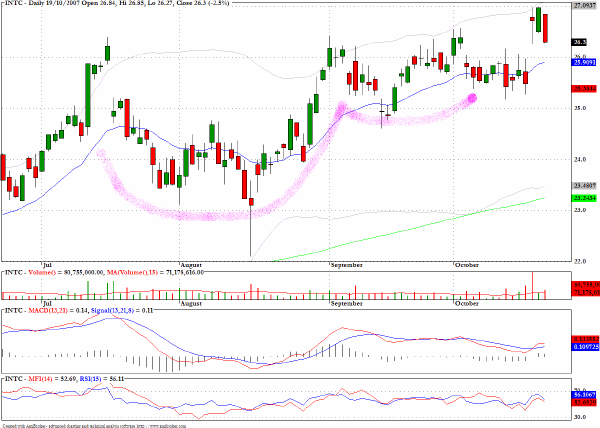
The chart for Intel (INTC) showed relative strength during last week’s weakness and some constructive patterns appear on the chart.
Clive Corcoran is the publisher of TradeWithForm.com, which provides daily analysis and commentary on the US stock market. He specializes in market neutral investing and and is currently working on a book about the benefits of trading with long/short strategies, which is scheduled for publication later this year.
Disclaimer
The purpose of this article is to offer you the chance to review the trading methodology, risk reduction strategies and portfolio construction techniques described at tradewithform.com. There is no guarantee that the trading strategies advocated will be profitable. Moreover, there is a risk that following these strategies will lead to loss of capital. Past results are no guarantee of future results. Trading stocks and CFD's can yield large rewards, but also has large potential risks. Trading with leverage can be especially risky. You should be fully aware of the risks of trading in the capital markets. You are strongly advised not to trade with capital.
|