NASDAQ COMMENTARY
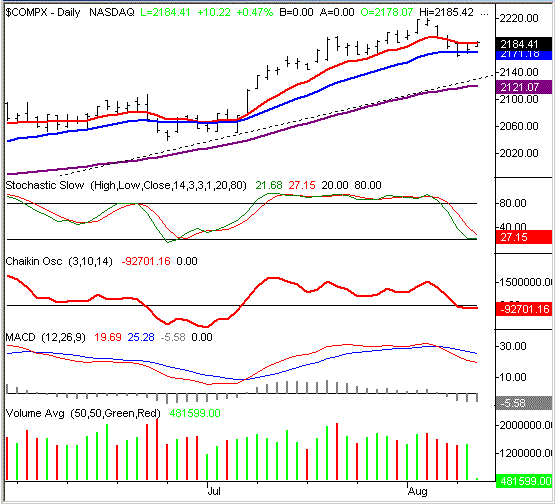
After Monday's close under the 20 day line, it finally looked like we'd get that correction that's been brewing for a while. The bulls bounced back on Tuesday though, pushing the NASDAQ back above the 20 day line (although conceding most of the intra-day gains). We got off to a strong start Wednesday too, but again, we've given some of the gain. Today's high is 2185.42. That's above the 20 day average (blue), but the dance around the 10 day average (red) has been indecisive so far. In fact, the 10 day line may be the key culprit here. It served as resistance on Monday and Tuesday, and even though we traded above it briefly today, we want to see if the buyers are this bold by the end of the day.
Despite the second day of gains, the bearish signals are still in place. Our MACD crossunder from Friday is still widening, and the Chaikin line is still under zero. So where's the strength coming from? From being oversold. Notice how both stochastic lines were near 20. It took about three days to get there, which can certainly be put into the 'too far/too fast category'. A bit of a bounce was to be expected. From a weekly perspective, we can ignore that the NASDAQ broke down last week, and that a lot of technical damage was done.
The degree of any fall should be minimal though. We've seen stocks remain resilient all year long, and it's unlikely that anybody would let the NASDAQ Composite slip too far before buying in again. We'll set support for the composite at 2128 (dashed), and at 2121, where the 50 day line is now. Short-term resistance is still the 10 day line at 2183, but the more important resistance level is last week's high of 2220.
NASDAQ CHART - Daily

S&P 500 COMMENTARY
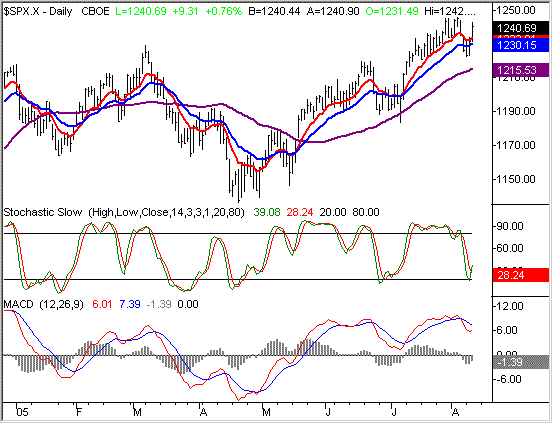
The S&P 500 surprisingly remains the strongest of our three indexes. The Dow is nowhere near its highs for the year, while the NASDAQ was barely able to reach its peak. The S&P 500, though, is currently 10 points above its March peak....and this is after last week's carnage. From a macro perspective, we have respect the strength of the large-caps right now (a strength that is suspiciously missing from the Dow though).
Like the NASDAQ, the SPX is somewhat trapped. The index is back above the 10 and 20 day lines, but under the recent high of 1245.86. We'll set our resistance there at 1246. As for support, the 10 and 20 day lines (at 1234 and 1230 respectively) are still a factor, but they didn't do a very good job of keeping the index aloft last week. We'll set our primary support line at the 50 day average, or 1215. That leaves plenty of room for us to get a nice healthy pullback, without threatening the overall bullishness we're enjoying right now.
S&P 500 CHART - DAILY

DOW JONES INDUSTRIAL AVERAGE COMMENTARY
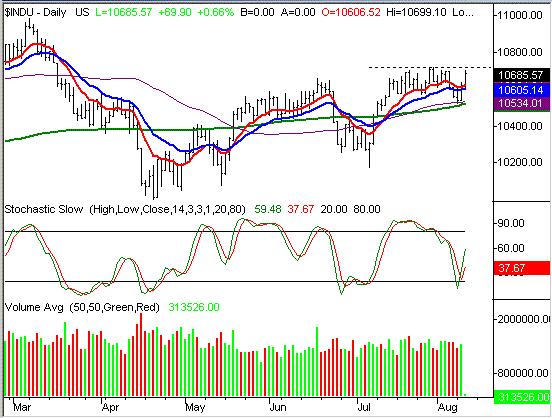
The Dow's encounter with the 50 day average on Monday ended up defining it as a support level. That was essentially the Dow's low on Tuesday, and the index has managed to move back above the 10 day line (red) today....so far. The Dow is currently at 10,694. You may recall that the 10,717 mark was as high as the index could get a couple of weeks ago, and that 10,719 was the topping point several times since mid-July. That's largely why we're seeing the advance halted here.
Basically, that leaves this blue-chip index stuck between a rock and a hard place. The resistance at 10,719 will be tough to cross, but the 50 day line at 10,534 (purple) has proven itself to be support. We still think that we have more downside ahead of us though, and that the support will ultimately be broken. Why? Several reasons. Despite the fact that the Dow is above all the key averages right now, we suspect that this rally is just the backlash from strong selling last week. Plus, the NASDAQ is lagging - it should be leading if this bull trend were for real. That said, we're prepared to switch gears if the Dow manages to make a couple of closes above 10,719. Note, however, that 10,719 was reached today, and that was precisely the point at which stocks started to retreat. In the meantime, the wisest move to make here may be to do nothing until we break out of this range.
DOW JONES INDUSTRIAL AVERAGE CHART - DAILY

Price Headley is the founder and chief analyst of BigTrends.com.