A very basic momentum methodology you can devise is the idea that if a close is above a given closing average, you buy and if it's below a given closing average, you sell. Interestingly, this is counter to the one-day close we discussed previously, where a down close signals an up bias and up close suggests a down bias (referenced article here). In today's article, we learn that when you average a series of closes, you get an opposite result.
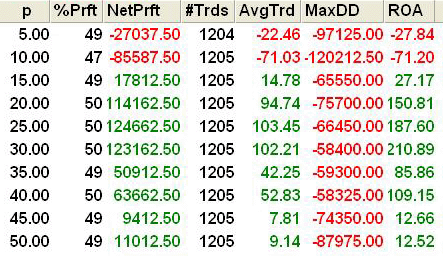
As you can see in the S&P optimization result of Figure 1, most values for the average number of days are positive.

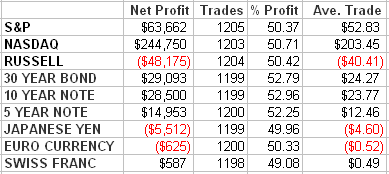
Forty days seems to be particularly robust across the financial market array as Figure 2 reveals.

Some are better than others obviously. Tomorrow, we'll show how to nudge the results higher via an alternate relationship between closes and ranges.
Art Collins is the author of Market Beaters, a collection of interviews with renowned mechanical traders. He is currently working on a second volume. E-mail Art at artcollins@ameritech.net.