| The McMillan Options Strategist Weekly |
| By Lawrence G. McMillan |
Published
10/25/2007
|
Options
|
Unrated
|
|
|
|
The McMillan Options Strategist Weekly
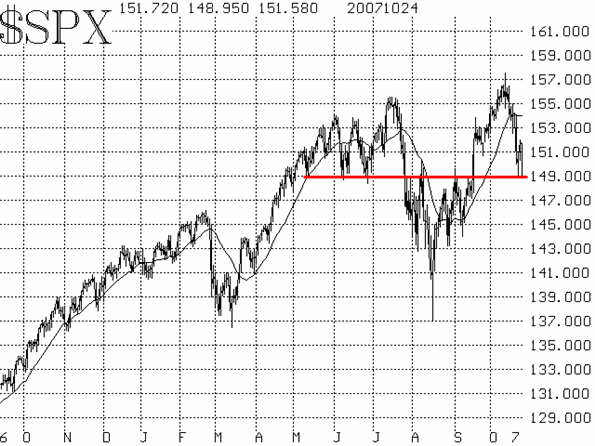
$SPX fell through several support levels during last week's decline, most of them coming on the 19th. The first level was 1540-1550, and then 1520-1530. Both were washed out during that decline, leaving the important 1490 level as the next support.
Even so, the most bullish indicator that we see right now is the chart of $SPX itself. We have previously mentioned that the 1490 level is important. Last summer, it was support, until broken in August. Then it became resistance until the new rally was launched in September. Now it remains as support again. Three times this week, $SPX has fallen to 1490 intraday (once on Monday and twice today), only to rally strongly each time. That is the definition of support. So, as long as it holds, the $SPX chart remains bullish.

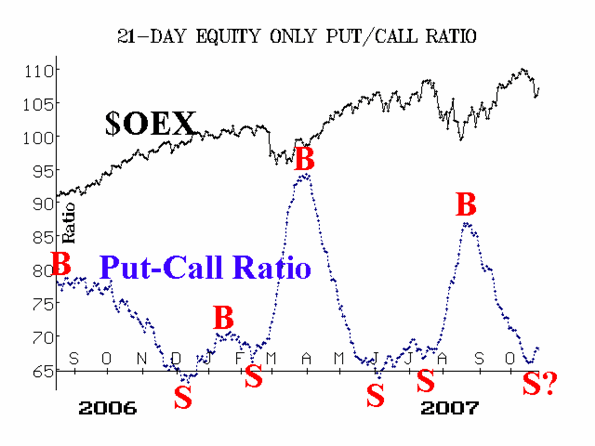
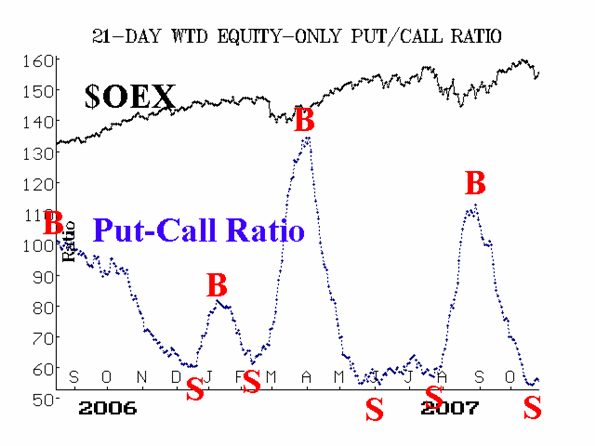
The equity-only put-call ratios have turned negative, rolling over to sell signals. However, if you'll notice the previous sell signals, they were actually double sell signals before the market caved in. So something similar could be lining up this time as well.

Market breadth (advances minus declines) has been extremely poor since the averages topped out on October 9. This culminated in a full-blown oversold reading on October 19. The improvement in breadth early this week has improved things somewhat. While we use breadth mostly as a confirming indicator rather than a leading one, this is still encouraging.

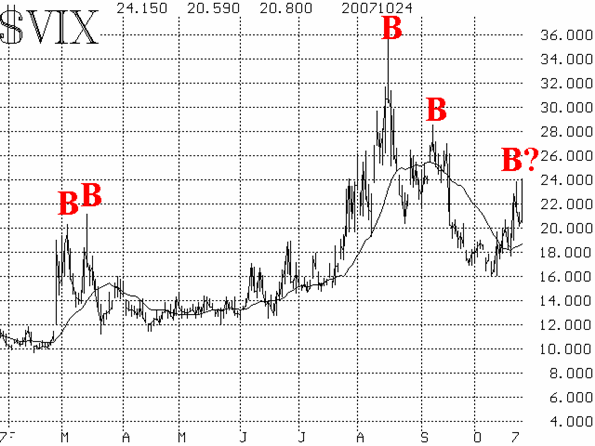
Both $VIX and $VXO rose rather sharply last week and into the early part of this week. As a result, $VIX has the possibility of turning bearish -- a classification we would bestow upon it only if it were truly in an uptrend. If one uses the 20-day moving average of $VIX as a guide, it is looking bearish, for it has begun to curl upwards (see Figure 4). However, things can change quickly with $VIX, and if it should close below 19, then the bullish case would once again be in force. In fact, if it did that (close below 19, that is), there would be something of a spike peak on the $VIX chart above 24, from Monday's and Wednesday's market action -- more bullish fodder.

Despite the deterioration in the indicators, we remain bullish as long as $SPX continues to close above 1490.
Lawrence G. McMillan is the author of two best selling books on options, including Options as a Strategic Investment, recognized as essential resources for any serious option trader's library.
|