| Corcoran Technical Trading Patterns for October 29 |
| By Clive Corcoran |
Published
10/29/2007
|
Stocks
|
Unrated
|
|
|
|
Corcoran Technical Trading Patterns for October 29
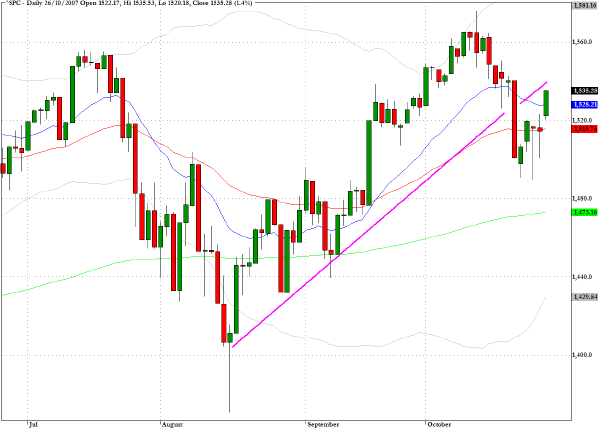
The S&P 500 (^SPC) has recovered from the violation of the trend line that I have drawn and is now poised to re-cross the extension of that line. In the current environment I would not be surprised to see another move back to the recent highs either on the back of some post easing euphoria or on any decline in the price of crude which will, such is the degree of optimism, be interpreted as profoundly bullish for the economy.
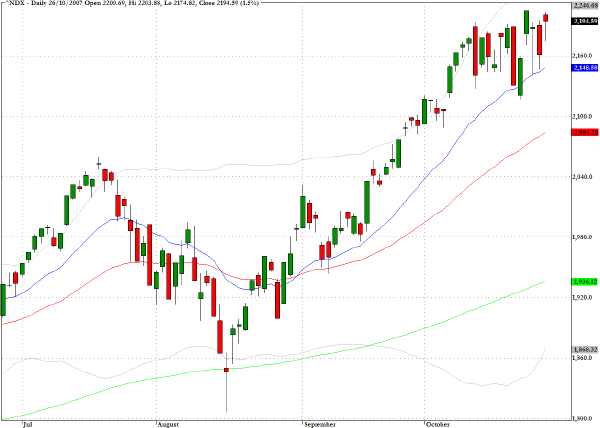
Last week, I commented on the rather uneasy and nervous quality to sentiment that is being revealed on the chart patterns for the Nasdaq 100 index (NDX). Friday's long lower tail with a close at the top of the recent range underlines the fact that there is relatively weak conviction on the short side at the moment but also, in view of the impending FOMC meeting, a hesitation to push too hard for an upward break to new multi-year highs.
Reviewing the overseas action as this is being written, the rallies in Asia and Europe - the Hang Seng was up by almost four percent, Mumbai by more or less the same percentage and at one point an almost two percent rally for the UK's FTSE - it is hard not to escape the conclusion that asset managers see much greater risk in getting left behind and delivering sub standard returns than extending themselves too far in such elated and febrile market conditions.
This patently bullish behavior is even more remarkable in the face of increasing geo-political tensions involving Iran, the possibility of $100 crude as well as a lamentable performance by the world's reserve currency.
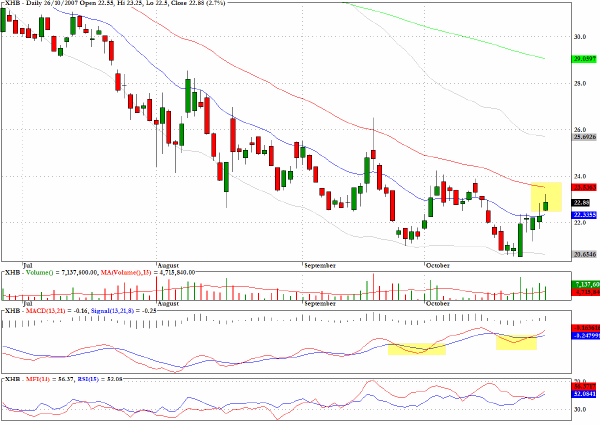
The homebuilding sector fund XHB has been showing some signs of vitality again, possibly as those who have enjoyed the ride down are starting to retire short positions. The sector is poised to break above a long term downward trendline which almost coincides with the 50-day EMA. If there is decisive penetration through these levels there could be a tradable recovery rally, although I would not recommend getting too comfortable on the long side.
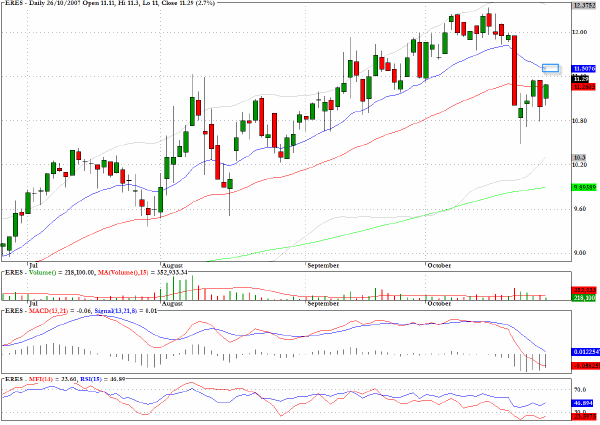
eResearch Technology (ERES) may pull back further to the 20-day EMA level close to $11.50 but the pattern suggests that it could be vulnerable to further selling pressure.
Schering Plough (SGP) has pulled back in quite a steep channel on subdued volume and may find rejection at the intersection of two moving averages above Friday's close.

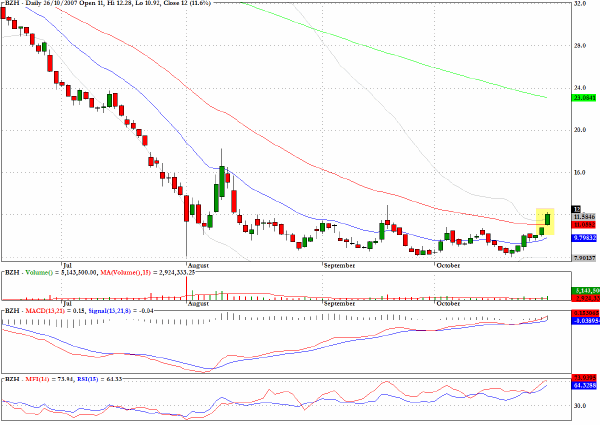
Beazer Homes (BZH) has one of the most positive charts amongst the homebuilders and has now cleared the 50-day EMA hurdle.
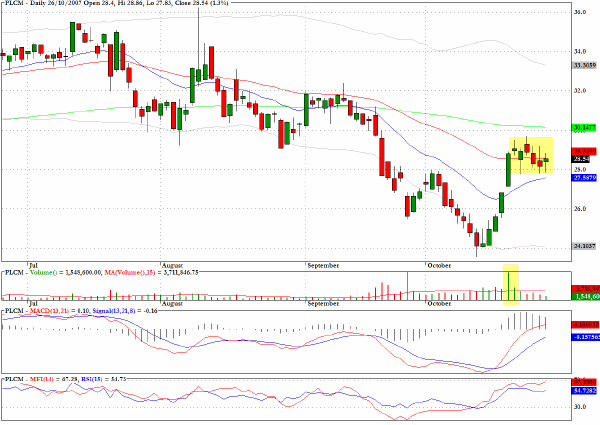
Polycom (PLCM) has entered a congestion pattern after several strong upward sessions. The 200-day EMA just above $30 seems like a plausible target for short term traders.
Clive Corcoran is the publisher of TradeWithForm.com, which provides daily analysis and commentary on the US stock market. He specializes in market neutral investing and and is currently working on a book about the benefits of trading with long/short strategies, which is scheduled for publication later this year.
Disclaimer
The purpose of this article is to offer you the chance to review the trading methodology, risk reduction strategies and portfolio construction techniques described at tradewithform.com. There is no guarantee that the trading strategies advocated will be profitable. Moreover, there is a risk that following these strategies will lead to loss of capital. Past results are no guarantee of future results. Trading stocks and CFD's can yield large rewards, but also has large potential risks. Trading with leverage can be especially risky. You should be fully aware of the risks of trading in the capital markets. You are strongly advised not to trade with capital.
|