NASDAQ COMMENTARY
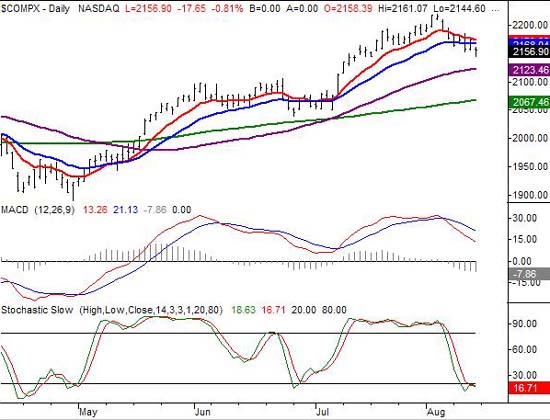
Although the week was less than great for all the indexes, it was particularly rough for the NASDAQ Composite. The index dropped 21 points to close at 2156.90. Aside from that dip, there was some bearish momentum established that looks like it's going to keep dragging these stocks lower. So, needless to say, we're looking for the NASDAQ to keep selling off for at least a few more days.
The primary problems here are the cross back under the 10 and 20 day average (red and blue, respectively). Friday's close under these lines was the third instance of it in the last five days, with Friday's end being the lowest close of those three. We made the lowest low of the week then too. Like we said, ending the week on a sour note is only going to inspire the bears, while any would-by buyers should be sidelined until things dramatically improve.
As we mentioned last week, the likely landing points for this dip are the 50 day line and the 200 day line. The former is at 2123, and the latter is at 2067. Neither have been terribly precise support levels though, so we only want to mark those lines as a likely zone of when we might bounce again. Other than that, there's not much new to say. We're still in the wake of a bearish MACD cross, and the 10 and 20 day lines are acting like resistance.
NASDAQ CHART - DAILY NASDAQ COMMENTARY
Although the week was less than great for all the indexes, it was particularly rough for the NASDAQ Composite. The index dropped 21 points to close at 2156.90. Aside from that dip, there was some bearish momentum established that looks like it's going to keep dragging these stocks lower. So, needless to say, we're looking for the NASDAQ to keep selling off for at least a few more days.
The primary problems here are the cross back under the 10 and 20 day average (red and blue, respectively). Friday's close under these lines was the third instance of it in the last five days, with Friday's end being the lowest close of those three. We made the lowest low of the week then too. Like we said, ending the week on a sour note is only going to inspire the bears, while any would-by buyers should be sidelined until things dramatically improve.
As we mentioned last week, the likely landing points for this dip are the 50 day line and the 200 day line. The former is at 2123, and the latter is at 2067. Neither have been terribly precise support levels though, so we only want to mark those lines as a likely zone of when we might bounce again. Other than that, there's not much new to say. We're still in the wake of a bearish MACD cross, and the 10 and 20 day lines are acting like resistance.
NASDAQ CHART - DAILY
DOW JONES INDUSTRIAL AVERAGE COMMENTARY
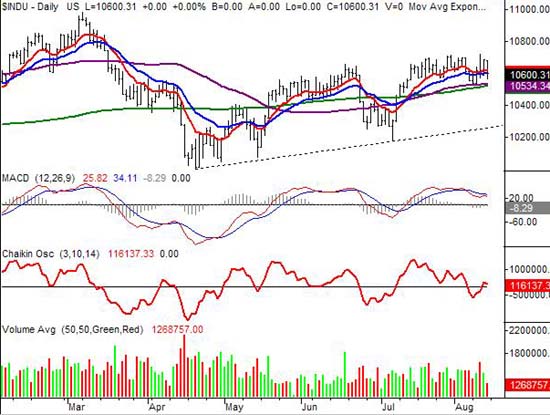
While there's some congestion for the NASDAQ and the S&P 500, there's even more for the Dow Jones Industrial Average. This blue chip index closed under its 10 and 20 day averages on Friday, and is within 74 points of falling under its 200 day line. True, the Dow didn't sink last week, but we can see that there's been a major consolidation period over the last month. That congestion is what prevented the Dow Jones Average from hitting new 52-week highs the way its counterparts did, and we have to wonder if that spells out a particular brand of trouble for this group of stocks.
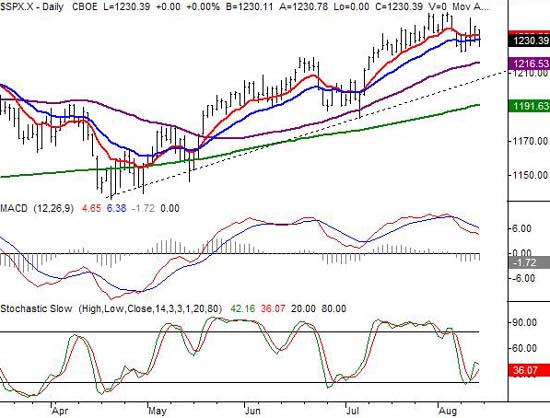
Basically, the story is the same - we think the Dow is headed lower before headed higher. We won't be able to use the 50 and 200 day averages as support areas though. Instead, we'll plot the intermediate-term support line (dashed). This is the same support line we plotted for the S&P 500 (tagging the lows from 4/20 and 7/07). That leaves this index nearly 350 points to fall. Yet, such a fall wouldn't be devastating - it would actually be a typical correction. Are we worried about the cross under the long-term averages? Not really. The 50 and 200 day lines have meant very little this year - at least as far as support and resistance goes.
In the meantime, both volume and momentum are telling us the sellers are in charge. We're now five days into a bearish MACD crossunder, and we say a Chaikin line cross under zero occur at the same time. The Chaikin indicator actually crossed back above zero on Thursday, but the volume bars at the bottom of the chart are still phasing in red and phasing out green.
DOW JONES INDUSTRIAL AVERAGE CHART
Price Headley is the founder and chief analyst of BigTrends.com.