| Corcoran Technical Trading Patterns for October 30 |
| By Clive Corcoran |
Published
10/30/2007
|
Stocks
|
Unrated
|
|
|
|
Corcoran Technical Trading Patterns for October 30
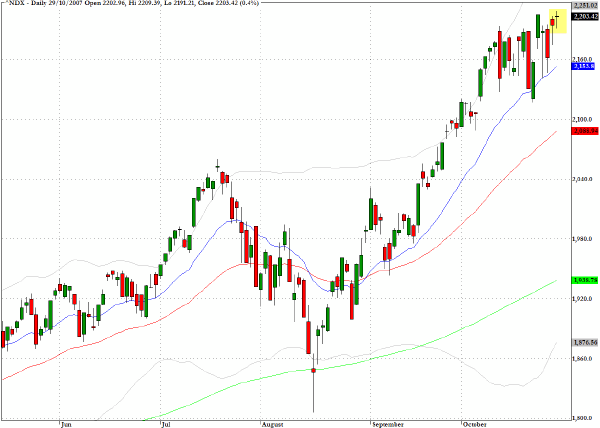
After several sessions with large intraday swings the Nasdaq 100 (^NDX) had a relatively quiet session recording its smallest range in more than two weeks. The resulting doji star candlestick reveals a range contraction session that almost certainly is due to the impending interest rate decision and can also be the precursor to a strong directional impulse.
Anecodotally, one of the things that caught my eye this morning is the fact that as a consequence of the exalted performance by India’s stock market in recent days, the industrialist Mukesh Ambani is now the world’s richest person surpassing Bill Gates for the first time.
Mr Ambani’s Reliance Industries has been on a roll recently and after the Mumbai Sensex (^BSESN) index’s close just short of the 20,000 level yesterday, the net worth of its chairman and managing director, according to reports, rose to $63bn.
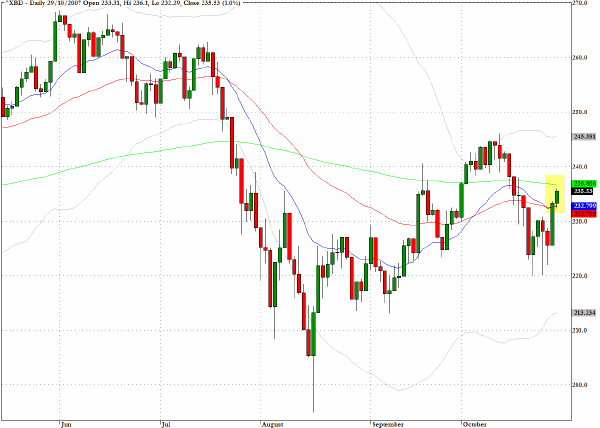
The investment banking sector (^XBD) has been meandering within a relatively narrow trading range and the volatility bands are constricting along with all three key moving averages which are converging. This condition suggests that a directional breakout could be imminent and the catalyst may be the FOMC decision.
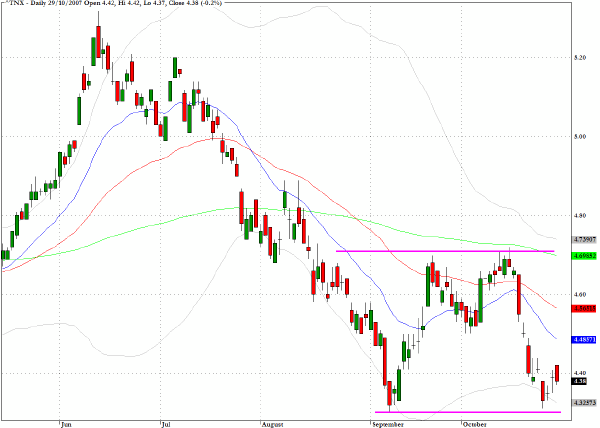
A similar argument to the one just noted for the investment banks could be made for the longer-term Treasury instruments.
The chart shows a box pattern with only thirty basis points covering the spread in yields since early September. While this confined range might be prolonged, several factors could force a more definitive move beyond this box. Dollar weakness might limit the possibilites of a break below 4.4% but a weak employment report on Friday could certainly see this floor being tested.
TRADE OPPORTUNITIES/SETUPS FOR TUESDAY OCTOBER 30, 2007
The patterns identified below should be considered as indicative of eventual price direction in forthcoming trading sessions. None of these setups should be seen as specifically opportune for the current trading session.
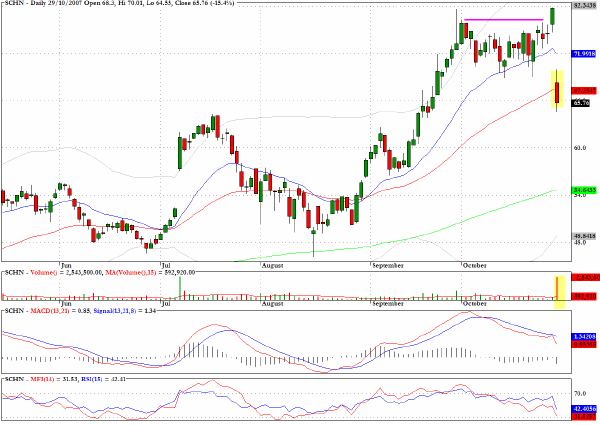
In my weekend commentary I noted that Schnitzer Steel (SCHN) appeared to be poised for a breakout in the context of a rather constructive chart pattern but also cautioned that the earnings release expected yesterday had the capacity to disappoint. Traders were not shy in showing their dissatisfaction with the announcement as the stock plummeted by more than 15%. This chart underlines the reason why it is always prudent not to be too confident in anticipating directional moves from technical characteristics in the midst of the quarterly earnings seasons.
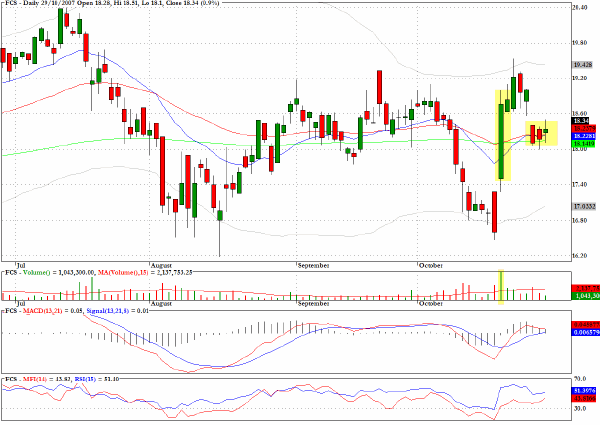
Fairchild Semiconductor (FCS) closed yesterday on top of all three moving averages that we track. I am intrigued by the strong impulse that lifted the stock on October 18 on very heavy volume and would be monitoring the stock intraday for signs of resumed buying pressure.
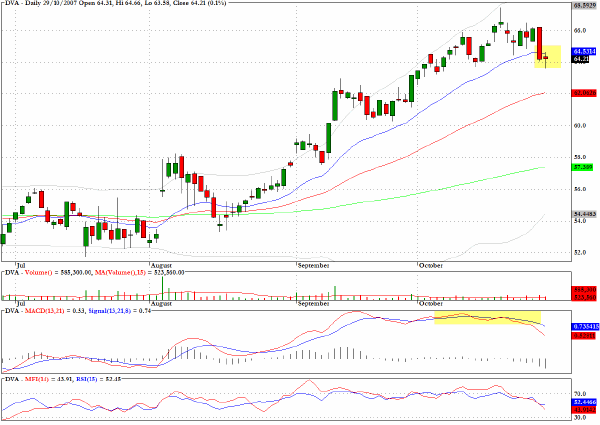
Momentum fatigue is showing on the chart for Davita (DVA).
Clive Corcoran is the publisher of TradeWithForm.com, which provides daily analysis and commentary on the US stock market. He specializes in market neutral investing and and is currently working on a book about the benefits of trading with long/short strategies, which is scheduled for publication later this year.
Disclaimer
The purpose of this article is to offer you the chance to review the trading methodology, risk reduction strategies and portfolio construction techniques described at tradewithform.com. There is no guarantee that the trading strategies advocated will be profitable. Moreover, there is a risk that following these strategies will lead to loss of capital. Past results are no guarantee of future results. Trading stocks and CFD's can yield large rewards, but also has large potential risks. Trading with leverage can be especially risky. You should be fully aware of the risks of trading in the capital markets. You are strongly advised not to trade with capital.
|