Last week's volatility shook things up pretty well, and prevented any new sector trends from taking shape. So without anything new to discuss, we'll take this opportunity to update some of our recent Sector Spotlights. After that, be sure to review a new sector rotation analysis methodology we've been working on.
1) Update on water utilities. Back on June 28, we went bullish on the obscure water utilities. At the time, the Dow Jones Water Utilities Index (DJUSWU) was at 622.50. We set our target at 690, expecting an 11% move for these stocks. Directionally we were right, but we underestimated how far this index could go - it's currently at 740. We still like this industry, but at this point, the index is a little too far extended to by into. We'll go bullish on this sector again once we get a decent pullback. The 20 day average has been a good support level for this chart. It's currently at 688.5 and rising, so that buy point will need to be adjusted on a daily basis. But once we get that pullback, we'll look for another big move. This time, we'll set a target gain of 90 points - the final target will depend on where the index finally intercepts the 20 day average and when we buy into it. As we mentioned before, this is an obscure group, so you may have to search for some individual stocks to play this trend.
2) Update on biotech. On July 6, we issued a bullish forecast for biotech stocks. Then, the AMEX Biotech Index (BTK) was at 573, and had just broken to a new 52-week high (that's why we went bullish on the group). Our initial target was set at 640, which we almost hit on August 3rd with a high of 639.0. Since then, the index has fallen back to 613, and has been less than inspiring. However, we have to be patient here, so we'll remain optimistic on these stocks. The original stop on this bullish bias was a close under the 50 day average. At that time it was at 542, but now it's at 587.0.
3) Update on financials. The July 11 spotlight was on the financial sector. Based on the cross back above the 50 and 200 day averages, we thought these stocks had enough momentum to carry then them much higher. The S&P Financial Index was at 403 at the time, and we were targeting a price of 455. This index traveled modestly higher for a few more days, but began to pull back on July 18. With our stop based on the 50 day line, this bullish outlok was negated when the index crossed under the 50 day average on August 5. The closing price that day was 397.60. So, relative to our entry around 403, this outlook would have led to a very minor loss (-1.2%).
Recent Sector Rotation Trends
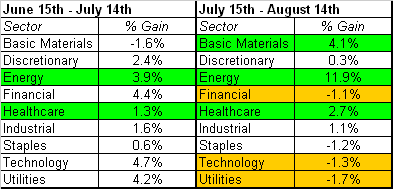
As part of our ongoing efforts to improve trading systems and educate our readers, we've been working with models designed to spot underlying shifts in sector strength. This methodology specifically uses performance (price change) rather than charts. Using charts alone can make it difficult to compare "apples to apples", especially when you're trying to spot rotation. Instead, we're going to compare performance (percentage gains) over the last month relative to the one-month gains from one month ago. Confused? Don't be. Just think of it as a "then and now" comparison. Take a look at how each sector performed (as of yesterday) for the last month, and compare that to how they performed for the prior month. After that, be sure to read below for our thoughts on the data.

The analysis is simple, but very telling. The basic materials look like they're trying to re-emerge as leaders, while energy and healthcare continue to move along at an even pace. The financials, tech stocks, and the utilities all headed south after serving as the leaders just a month before (proving that you should sell into strength). Energy looks tempting, but it will be very tough for those stocks to match the rally they've been through in the last month.
We may or may not continue posting this analysis, but even if we don't, it may be a worthwhile took to add to your studies.
Price Headley is the founder and chief analyst of BigTrends.com.