| Corcoran Technical Trading Patterns for November 5 |
| By Clive Corcoran |
Published
11/5/2007
|
Stocks
|
Unrated
|
|
|
|
Corcoran Technical Trading Patterns for November 5
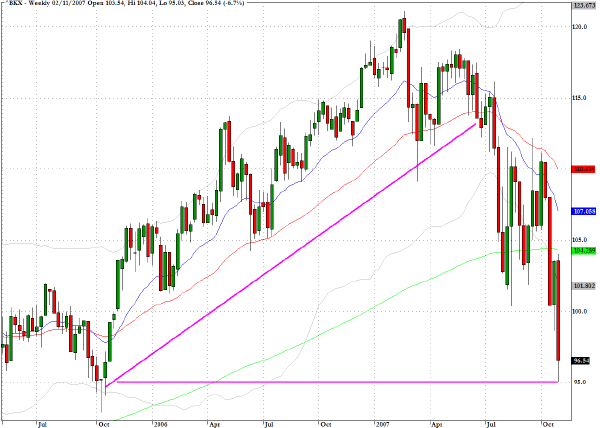
The weekly chart for the banking index (^BKX) reveals an intriguing pattern where the sector has now retreated to the level from October, 2005 from which the trendline that was clearly violated early this summer originated. Could this prove to be a support level where traders decide that the worst of the news is behind us? I suspect that this argument will be heard in coming days but I remain sceptical.
When top bankers are the lead story in the news media and when analysts suspect that there are more alarming discoveries to be unearthed as a consequence of the ingenious complexity of financial engineering, there almost certainly will be further upheavals in the credit markets in the weeks to come. Expect central bankers and politicians to be recycling all of the usual reassurances about the fundamentals of the world economy being sound. I believe that there is good reason to herald the vitality of the real global economy, but it just does not seem feasible that insidious corrosion at the heart of the financial economy can be brushed aside as sanguinely as some would have us believe.
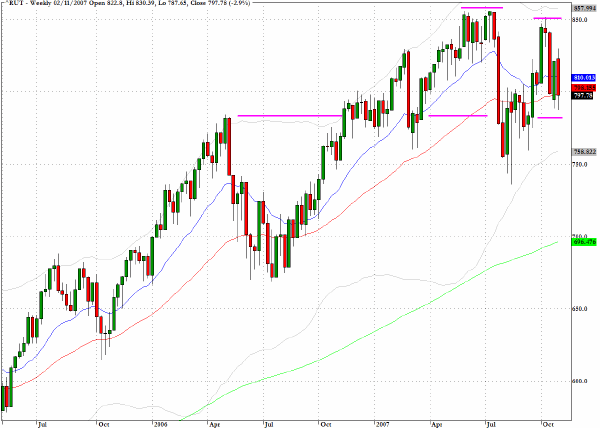
The Russell 2000 (^RUT) declined by 2.9% last week and the weekly chart below shows that there is a clear possibility that we have seen a lower high recorded in early October from that seen earlier in the summer. The 800 level has been breached and the next key level that is quite apparent on the weekly chart is the 780 level which represented strong resistance in April, 2006. For the underlying bullish argument to remain credible, it is important that the 780 should now hold as firm support.
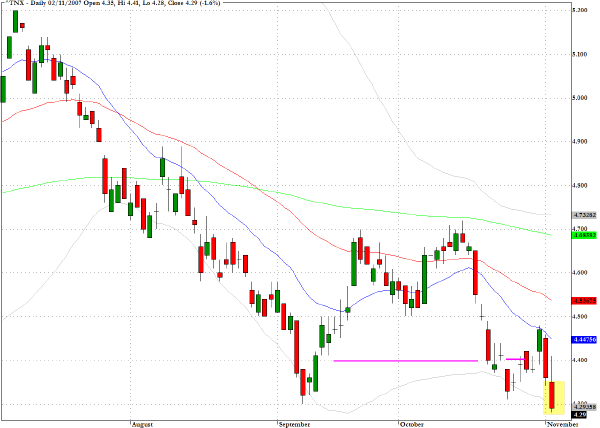
I recently suggested that the 4.4% floor on yields for the US ten-year Treasury note, which has been in place for more than two years, could well be breached, and Friday’s drop down to 4.29% could presage a sharper attrition in yields. Despite a positive reaction from some to Friday’s employment data, the Treasury yield barometer is pointing to the fact that bond traders are discounting a weaker economic environment than the consensus forecast of many institutional equity investors. This decline in yields is even more noteworthy given the persistent weakness in the dollar which continues to show any willingness to bounce. Ironically a full blown financial crisis would trigger panic dollar buying.
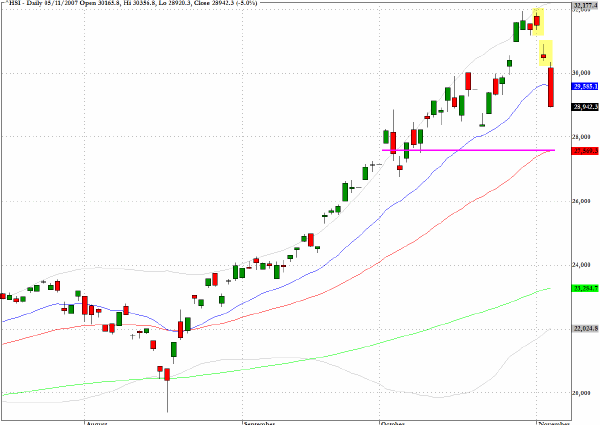
The Hang Seng Index (HSI) concluded Monday’s session with a five percent decline and as the chart reveals the probable short term target will be a test to see whether the 50-day EMA at 27600 will hold. The index has risen dramatically since the August low and a severe correction was to be expected, but the pertinent question is whether the 32000 level experienced last week will turn out to be a major top or just the point at which the current correction began.
To my mind there is too much complacency that the Chinese market will not succumb to bubble deflation until after the Olympics next year. The problem is that if traders are expecting that to happen but don’t want to be behind the curve, there may be a gradual creep forwards on the timing for this larger correction/crash.
TRADE OPPORTUNITIES/SETUPS FOR MONDAY NOVEMBER 5, 2007
The patterns identified below should be considered as indicative of eventual price direction in forthcoming trading sessions. None of these setups should be seen as specifically opportune for the current trading session.
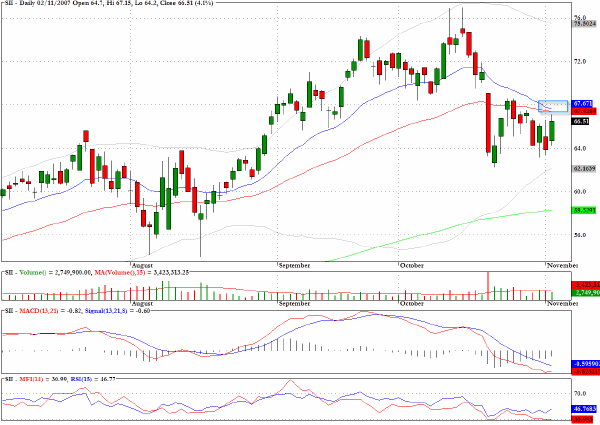
Smith International (SII) has been in a pullback phase on modest volume since the large sell off on October 19th and now faces a potential resumption of weakness as it approaches the resistance of the two key moving averages which have converged near to $68.
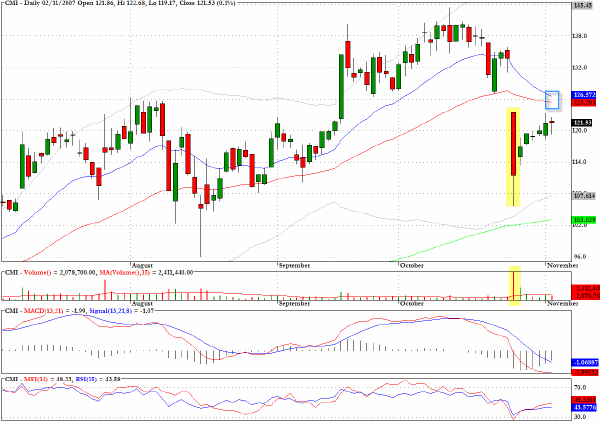
Cummins (CMI) has a similar pattern to SII and should be vulnerable close to $125.
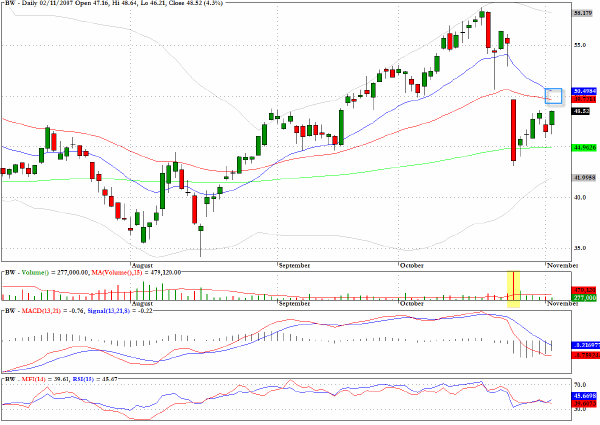
One more similar pattern to the previous two charts that we have examined is found for Brush Engineered Materials (BW).
Red Hat (RHT) appears to be poised for an upside breakout from a cup and handle pattern.

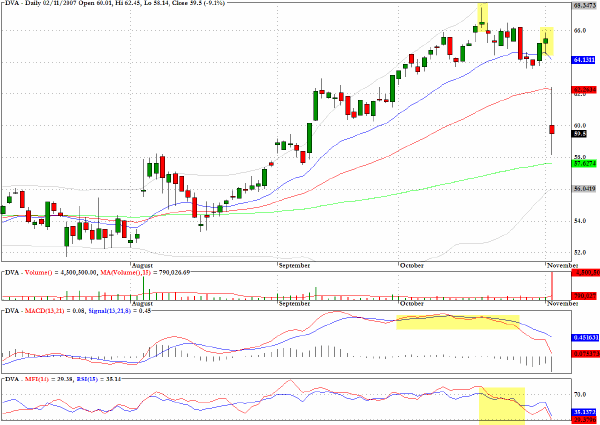
Last week I noted that there was momentum fatigue revealing itself on the chart for Davita (DVA). Friday’s nine percent decline followed on from the previous session that I have highlighted which constituted a clear lower high from the previous in mid-October.
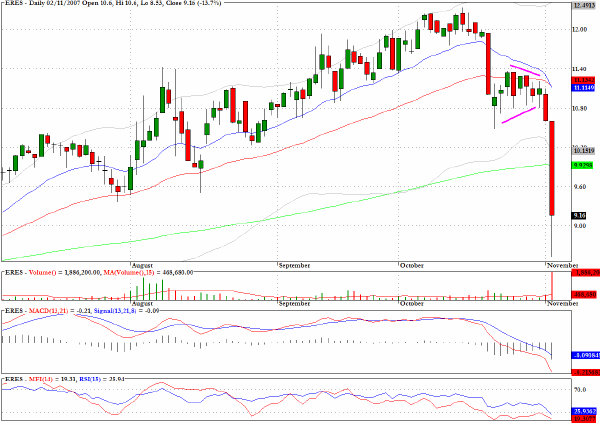
Another short candidate mentioned here last week performed very much in line with my comments then: "eResearch Technology (ERES) may pull back further to the 20-day EMA level close to $11.50 but the pattern suggests that it could then be vulnerable to further selling pressure."
Clive Corcoran is the publisher of TradeWithForm.com, which provides daily analysis and commentary on the US stock market. He specializes in market neutral investing and and is currently working on a book about the benefits of trading with long/short strategies, which is scheduled for publication later this year.
Disclaimer
The purpose of this article is to offer you the chance to review the trading methodology, risk reduction strategies and portfolio construction techniques described at tradewithform.com. There is no guarantee that the trading strategies advocated will be profitable. Moreover, there is a risk that following these strategies will lead to loss of capital. Past results are no guarantee of future results. Trading stocks and CFD's can yield large rewards, but also has large potential risks. Trading with leverage can be especially risky. You should be fully aware of the risks of trading in the capital markets. You are strongly advised not to trade with capital.
|