| Using Fibonacci Lines To Find Support and Resistance |
| By Price Headley |
Published
11/6/2007
|
Currency , Futures , Options , Stocks
|
Unrated
|
|
|
|
Using Fibonacci Lines To Find Support and Resistance
Today's column is intended to help us all figure out the likely support, resistance, and target levels for the three key indices. Only this time, we're going to utilize our newest tool: Fibonacci lines.
NASDAQ Composite
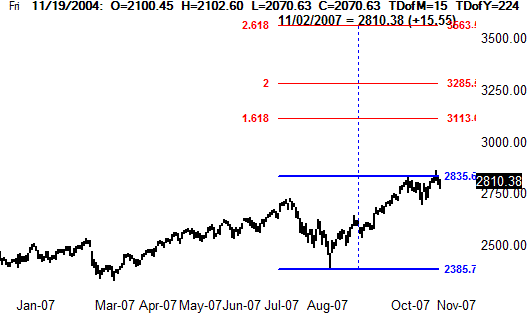
Let's find a potential upside target first. For Fibonacci fans, that's usually a 61.8% move beyond the peak from a major move, and then an outright double of the same span. That span in this case is the rally from 2387 to highs of 2816, marked by the blue lines. The 61.8% extension is at 3113, while the 100% extension is at 3285. However, don't forget that we need to see certain events, like breaks past ceilings, for those to become a factor.
NASDAQ Bullish Targets
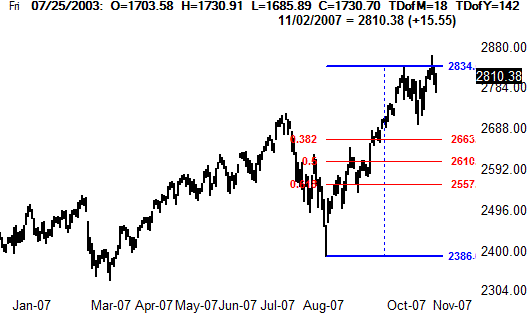
As for a downside/retracement target, we're using Fibonacci retracement levels. We're using the same span, framed in blue. The first major Fibonacci support line is at 2663, and the other is at 2557. That 50% retracement line at 2610 isn't actually a Fibonacci number, so we don't give it much weight even though we're showing it here.
NASDAQ Pullback Target
S&P 500
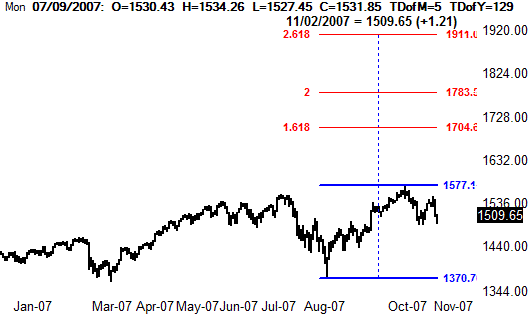
The same color code applies to the S&P 500 that we sued for the NASDAQ. The baseline span is framed in blue, with the key extension lines in red. For the SPX, the fist 61.8% target is at 1704, and the 100% extension is at 1783.
S&P 500 Bullish Targets
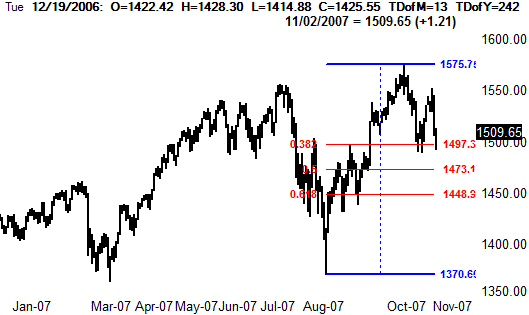
The likely retracement lines for the S&P 500 are at 1497 and 1449. Ring a bell? One of them might, as it was close to the support level we highlighted for the S&P 500 on Sunday. No, it's not perfect, but not off target enough to dismiss it. Only if the 1497 mark is breached on a closing basis will we then look to our other potential pullback target - 1449.
S&P 500 Pullback Targets
Dow Jones Industrial Average
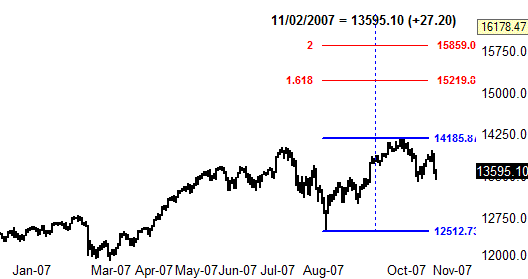
The Dow's upside move targets lie at 15,219 and 15,859.
DJIA Upside Targets
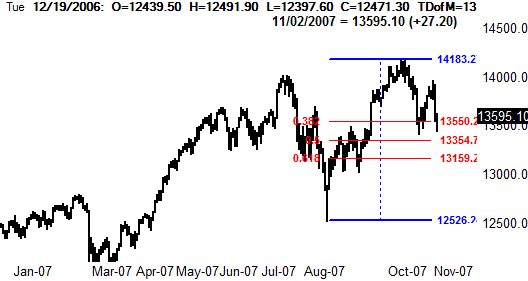
As for where any pullback for the Dow might find a stopping point, we're thinking 13,550 and 13,159. Like the S&P 500, the Dow's first Fibonacci retracement area might ring a bell, since it's already being tested (and so far has failed). The second one at 13,159 is still on the horizon though.
DJIA Pullback Targets
Though the Fibonacci lines are designed to be 'stand alone' tools, we suggest you cross reference them with the inherent support/resistance created by all of the key moving averages. In cases where there's overlap between all of these lines, a reversal may be even more likely there.
Price Headley is the founder and chief analyst of BigTrends.com.
|