| Corcoran Technical Trading Patterns for November 6 |
| By Clive Corcoran |
Published
11/6/2007
|
Stocks
|
Unrated
|
|
|
|
Corcoran Technical Trading Patterns for November 6
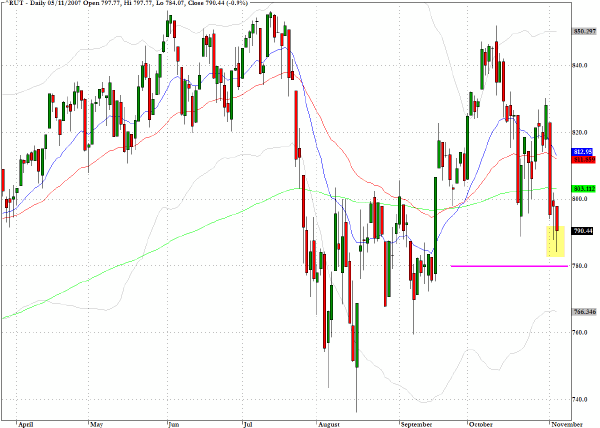
The Russell 2000 (^RUT) slipped further back in yesterday’s trading and reached down below the intraday low that was touched in Friday’s trading. I will be watching to see how much support is provided in the 780 vicinity, an area of chart support/resistance dating back more than a year, as the under-performance of the small caps remains another concern for equity markets that have a lot of adversity to contend with at present.
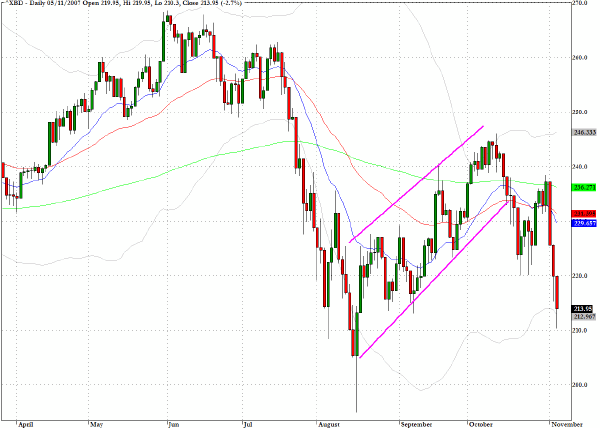
The financial sector remained under pressure again in yesterday’s trading with the banking index (^BKX), losing another one percent, but this was surpassed by greater weakness in the investment banking sector (^XBD). In particular, Goldman Sachs (GS) showed relative under-performance as it dropped almost five percent on fears that it may have greater adverse exposure to structured financial products than has hitherto been acknowledged. The mid-August intraday low for the sector may be a near-term target for the bears.
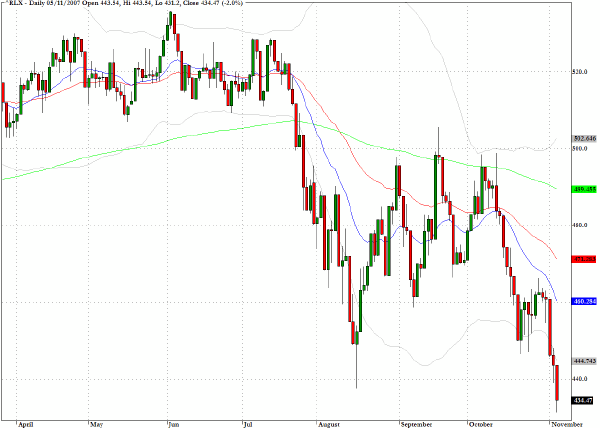
Charts of many retailers are showing distribution and the S&P Retail index (^RLX) closed at a new 52-week low.
TRADE OPPORTUNITIES/SETUPS FOR TUESDAY NOVEMBER 6, 2007
The patterns identified below should be considered as indicative of eventual price direction in forthcoming trading sessions. None of these setups should be seen as specifically opportune for the current trading session.
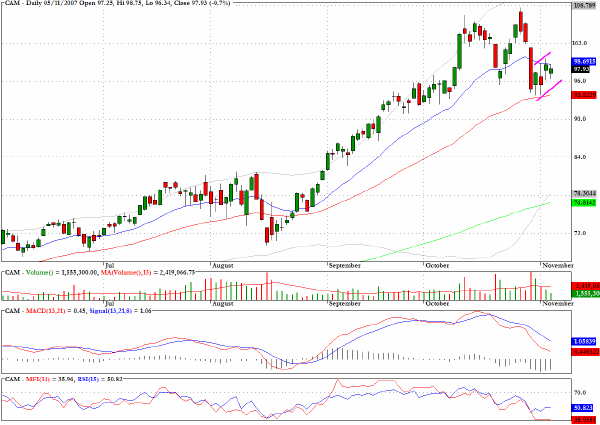
Cooper Cameron (CAM) has a bearish pullback pattern with negative divergences on both the MACD and MFI chart segments.
Featured in yesterday’s column as an example of a cup and handle pattern, Red Hat (RHT) appears to be on the verge of validating the upside breakout pattern.

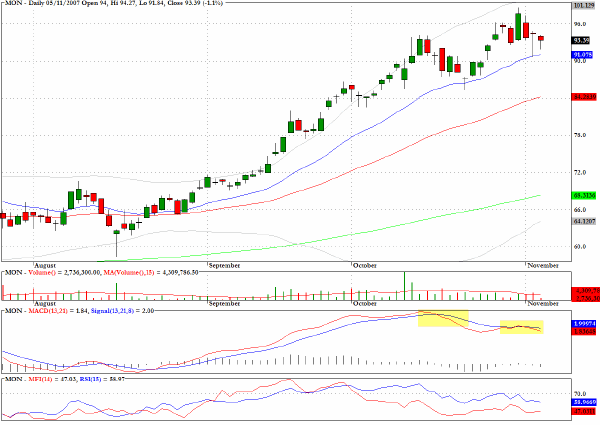
The chart for Monsanto Company (MON) is revealing negative momentum divergences.
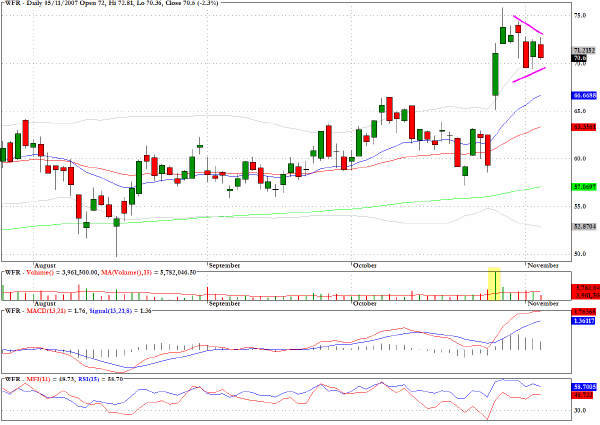
MEMC Electronics (WFR) has a pennant formation at an all time high with positive money flow characteristics.
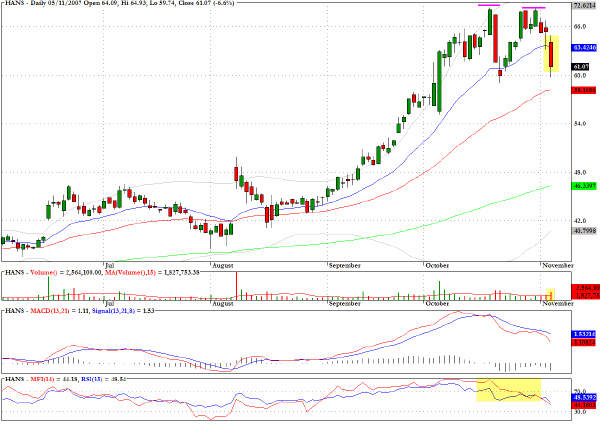
Hansen Natural (HANS) recently recorded a lower high, and the MFI chart shows that distribution was taking place during the revisit to the level above $66.
Clive Corcoran is the publisher of TradeWithForm.com, which provides daily analysis and commentary on the US stock market. He specializes in market neutral investing and and is currently working on a book about the benefits of trading with long/short strategies, which is scheduled for publication later this year.
Disclaimer
The purpose of this article is to offer you the chance to review the trading methodology, risk reduction strategies and portfolio construction techniques described at tradewithform.com. There is no guarantee that the trading strategies advocated will be profitable. Moreover, there is a risk that following these strategies will lead to loss of capital. Past results are no guarantee of future results. Trading stocks and CFD's can yield large rewards, but also has large potential risks. Trading with leverage can be especially risky. You should be fully aware of the risks of trading in the capital markets. You are strongly advised not to trade with capital.
|