| Corcoran Technical Trading Patterns for November 7 |
| By Clive Corcoran |
Published
11/7/2007
|
Stocks
|
Unrated
|
|
|
|
Corcoran Technical Trading Patterns for November 7
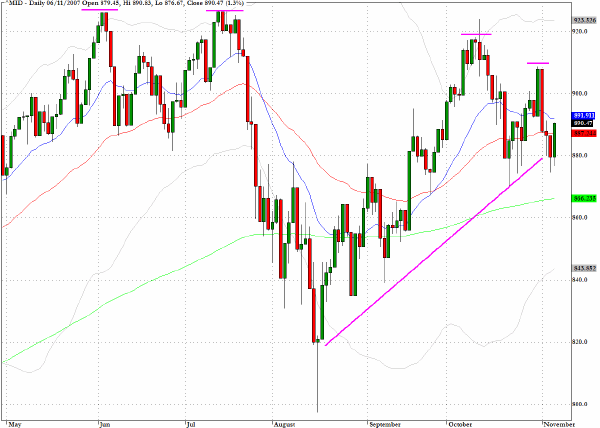
The chart for the S&P Midcap index (^MID) reflects quite visibly how the equity markets are poised at an inflection point with the balance of probabilities favoring the bearish case in the longer term. The very clear lower highs that have occurred since the twin historic peaks in the early summer are signs that the underlying dynamics have shifted from one where traders are looking to buy dips to one where they prefer to be selling rallies.
In a bullish scenario an upward slant to the lows (especially intraday lows) shows that traders are looking at sell-offs as an opportunity to add long exposure. Furthermore the activities of many similarly minded traders cause a gradual creep upwards in the registering of the daily lows. The dynamics for a distributive or corrective orientation shift to one where the tendency is for traders to want to sell rallies, and again it is the eagerness to be sure to sell close to where previous highs have been reached that results in a gradually declining succession of higher prices. This is why a declining trend-line through recent highs has such significance.
Just as problematic on the chart below is the recent breach of the trendline through the lows since mid-August, which also happens to be at the 50-day EMA.
There are positive seasonal tendencies between now and Thanksgiving and it would not be surprising to see further upward progress being made. However the risks of a serious decline are rising and unless the trend for successively lower highs can be decisively broken a crunch time will come when the path of least resistance will be down.
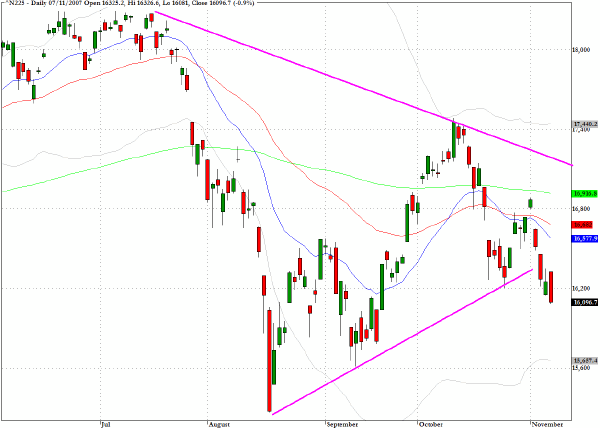
The Nikkei 225 (^N225) has one of the most negative charts of the major global equity indices. The index closed today’s trading with a one percent decline and many of the points raised in our discussion above are applicable to this index. The breach of the upward trendline which took place at the end of last week is even more pronounced than on the chart for the S&P Midcap index and today’s failure to mount a respite rally is tipping the balance in favor of further weakness.
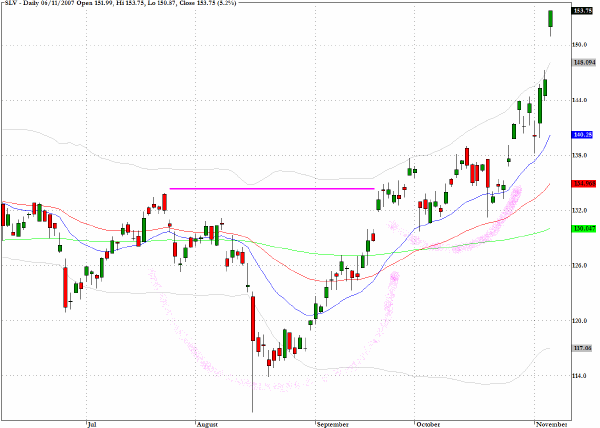
The chart for the exchange traded fund SLV which tracks the price of silver shows the impressive breakout that this metal has seen since mid-October. While the chart for gold shows a persistent rise since the mid-August low, the chart for this junior precious metal shows the cup and handle pattern that is often a precursor to explosive upward breakouts. With gold hurtling towards new all-time highs, the mining stocks surging (Newmont Mining has added almost fifteen percent in the last five sessions) and fears mounting regarding the integrity of paper assets, this band wagon could have a lot further to go.
TRADE OPPORTUNITIES/SETUPS FOR WEDNESDAY NOVEMBER 7, 2007
The patterns identified below should be considered as indicative of eventual price direction in forthcoming trading sessions. None of these setups should be seen as specifically opportune for the current trading session.
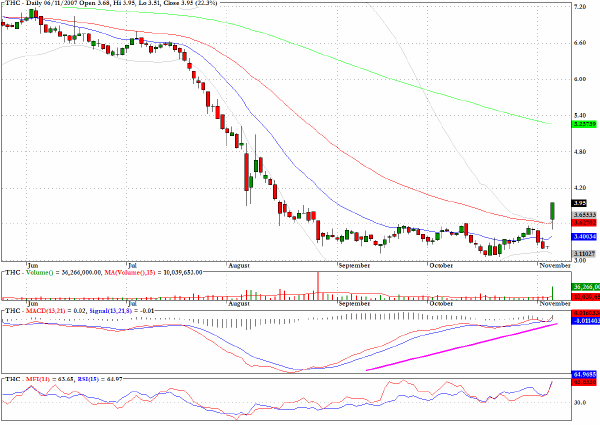
In my separately published weekend commentary I drew attention to the chart for Tenet Healthcare (THC) which reveals an extended basing pattern with a very constricted range. Monday’s session saw a tiny doji star candlestick and the stage was set for a dramatic breakout which happened in yesterday’s session. The stock surged ahead 22% on almost four times the average daily volume.
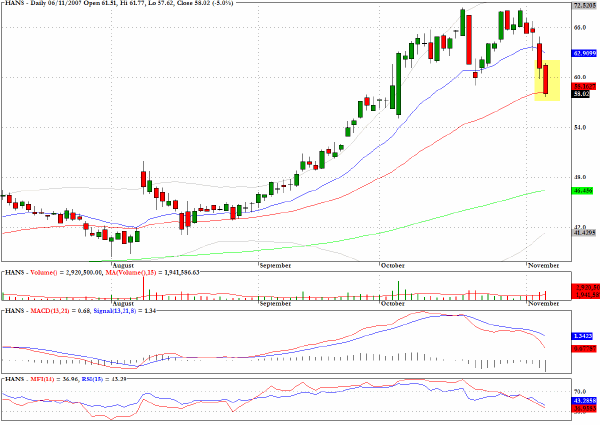
Hansen (HANS) was mentioned yesterday as a short candidate and the stock retreated by 5% with an attractive entry opportunity. The stock came to a rest at the 50-day EMA which could now provide some support.
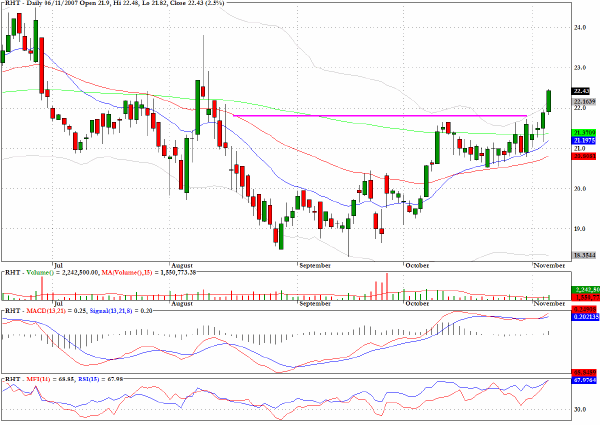
Red Hat (RHT) has begun the lift off pattern that I discussed over the last two commentaries.
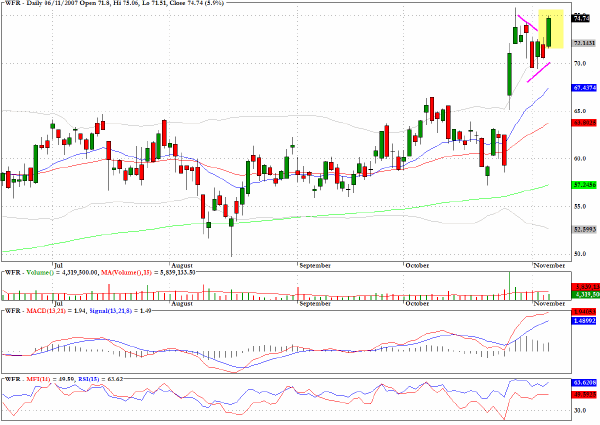
MEMC Electronics (WFR) moved up almost six percent from the pennant formation mentioned yesterday and once again there was an attractive entry opportunity.
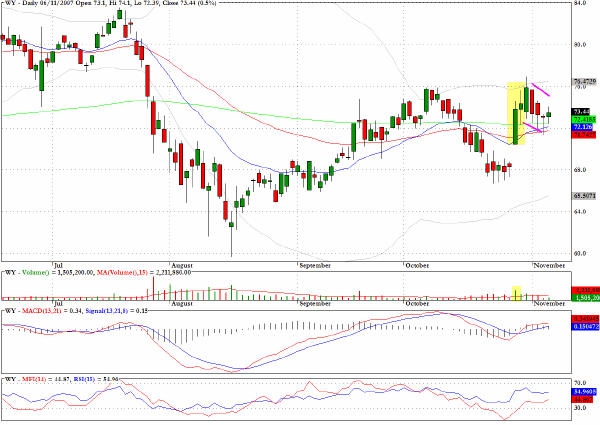
Weyerhauser (WY) has a bullish flag pattern and the proximity of yesterday’s close to all three moving averages suggests that the pullback pattern may have completed.
Clive Corcoran is the publisher of TradeWithForm.com, which provides daily analysis and commentary on the US stock market. He specializes in market neutral investing and and is currently working on a book about the benefits of trading with long/short strategies, which is scheduled for publication later this year.
Disclaimer
The purpose of this article is to offer you the chance to review the trading methodology, risk reduction strategies and portfolio construction techniques described at tradewithform.com. There is no guarantee that the trading strategies advocated will be profitable. Moreover, there is a risk that following these strategies will lead to loss of capital. Past results are no guarantee of future results. Trading stocks and CFD's can yield large rewards, but also has large potential risks. Trading with leverage can be especially risky. You should be fully aware of the risks of trading in the capital markets. You are strongly advised not to trade with capital.
|