| Corcoran Technical Trading Patterns for November 8 |
| By Clive Corcoran |
Published
11/8/2007
|
Stocks
|
Unrated
|
|
|
|
Corcoran Technical Trading Patterns for November 8
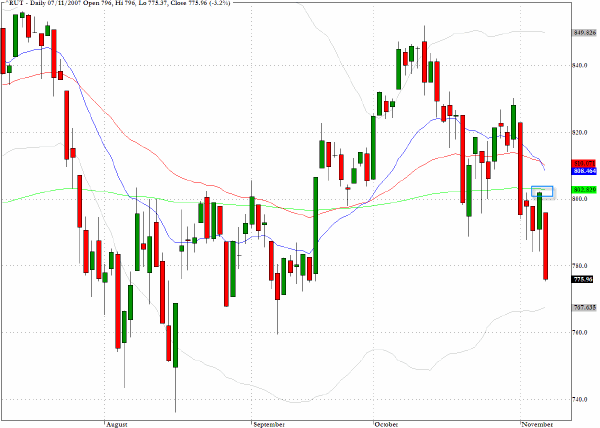
The Russell 2000 (^RUT) came down harder than the other indices yesterday but did not match the four percent decline from last Thursday. The 200-day EMA has now been decisively breached, and as the chart highlights, Tuesday's rally notably failed to lift the index back above this key moving average and the 800 level. Sentiment is very negative, perhaps too much so at present, and I would hesitate to get too confident on the short side, but it would not be alarmist to suggest that if we were to break below the mid-August lows on this index we could well see an avalanche of institutional selling.
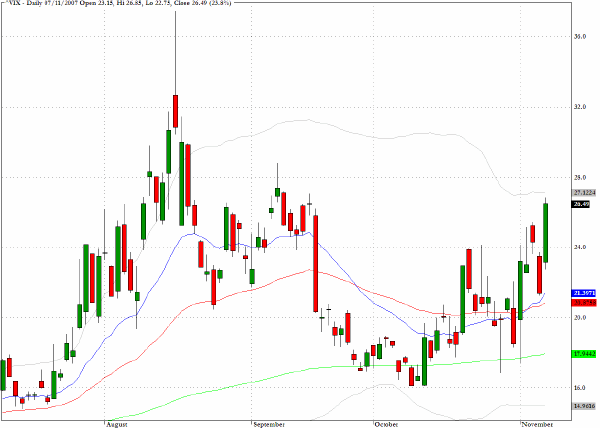
One of the few charts that moved up yesterday was the CBOE Volatility index (^VIX) which climbed by 23% and puts the previous elevated levels from August back in the framework. I would expect today's session to be quite erratic and for that reason I shall be on the sidelines.
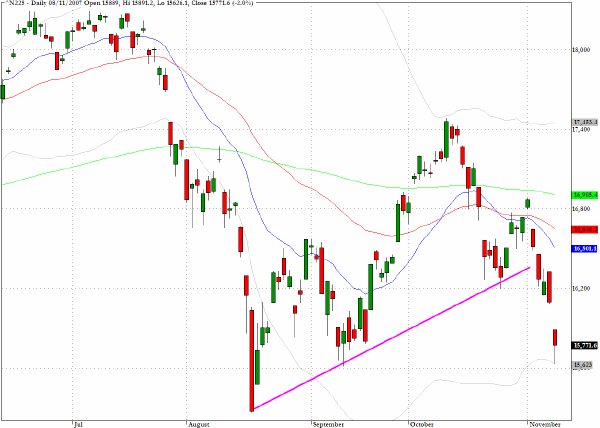
I discussed the chart for the Nikkei 225 (^N225) during my contribution to CNBC's European Closing Bell yesterday and made the point that this is one of the most bearish in appearance of all the major global indices. The sell-off in the US added further downward pressure in overnight trading Thursday and the index now looks to be headed towards a testing of the mid August low. In line with the concerns expressed regarding the Russell 2000 (^RUT) if the August 17 closing low of 15273 does not hold for the Japanese index, the next layer of support is in the region of 14500 which was last seen in June/July of 2006.
TRADE OPPORTUNITIES/SETUPS FOR THURSDAY NOVEMBER 8, 2007
The patterns identified below should be considered as indicative of eventual price direction in forthcoming trading sessions. None of these setups should be seen as specifically opportune for the current trading session.
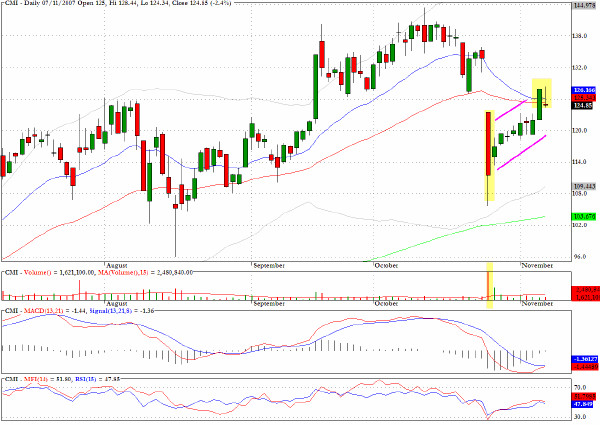
As mentioned I am wary of relying too much today on the charts following yesterday's very difficult session but I shall reiterate the point that I made earlier this week that Cummins (CMI) looks vulnerable close to the $125 level where it closed yesterday.
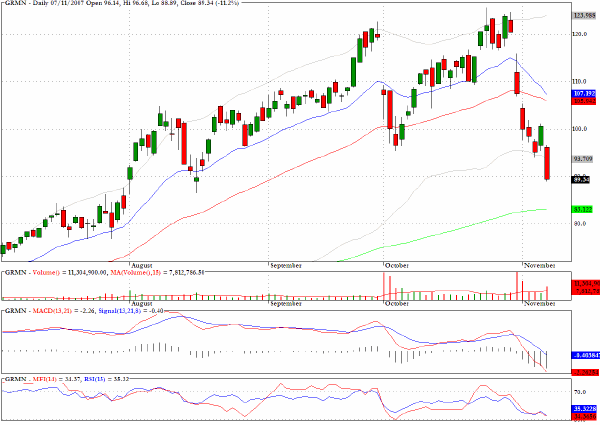
Readers will recall that I have been following the chart for Garmin (GRMN) quite closely not only because of its interesting technical characteristics but because of the bidding war with TomTom for TeleAtlas. The board for the mapmaker has today recommended to shareholders to accept the revised TomTom bid which will increase the commercial difficulties for Garmin.
Clive Corcoran is the publisher of TradeWithForm.com, which provides daily analysis and commentary on the US stock market. He specializes in market neutral investing and and is currently working on a book about the benefits of trading with long/short strategies, which is scheduled for publication later this year.
Disclaimer
The purpose of this article is to offer you the chance to review the trading methodology, risk reduction strategies and portfolio construction techniques described at tradewithform.com. There is no guarantee that the trading strategies advocated will be profitable. Moreover, there is a risk that following these strategies will lead to loss of capital. Past results are no guarantee of future results. Trading stocks and CFD's can yield large rewards, but also has large potential risks. Trading with leverage can be especially risky. You should be fully aware of the risks of trading in the capital markets. You are strongly advised not to trade with capital.
|