Every once in a while, there's a need to get on the soapbox. Today is one of those times. We've actually talked about this before, but for some reason, it struck me particularly hard on Monday. In this day and age of four TV news channels devoting their entire day to the stock market (and more, counting the channels that split time with the market and other world news), sometimes - as traders - the best thing to do is turn the TV off. Let's take a look at just a few examples of why.
First off, let me qualify all of this. We don't have a television set in any of our offices. It's just too distracting, and really not all that useful. We do have the internet though (obviously), which can lead to the exact same problem. In fact, the internet may be even more distracting, since the data is practically infinite. But for today's column, let's just lump TV and the internet together. In fact, we can throw in the Wall Street Journal and other print publications into that mix too. They're all potential pitfalls to good trading, and even good investing. Let's take a look at three examples.
1) At 9:40 AM we saw this headline from Briefing.com....."Market opens modestly lower as investors struggle to find reasons to get back into the market following Friday's sell-off.". Just 20 minutes later, we got this one....."Equities still on the defensive as the bulk of sector leadership remains negative." Anyone reading these notes at face value would assume that it meant stocks were supposed to be in trouble for the day. Unfortunately, by the time the session ended, the Dow was up 34 points (0.32%). That's not a huge gain, but compared to the hole that this news made stocks appear to be in, it's a major turnaround that probably had a lot of traders on the wrong side of the chart.
2) At 4:44 PM we got this from an Associated Press story....."Gas Prices Hit New High of $2.55 a Gallon......Record crude oil prices have continued to plague motorists at the pumps. Persistent increases in global demand were exacerbated last week by refinery problems in the United States." Literally, two minutes later, AP released another story...."High Gas Prices Not Deterring Motorists......Soaring gasoline prices are getting a rise out of many U.S. motorists, but by and large they're not getting in the way of summer vacations, commuting habits or SUV sales." Neither story was incorrect, but it's definitely a mixed message. From a trader's perspective, this too can be confusing. One story implies that the consumer is just going to tolerate it, while the other one implies that they're not.
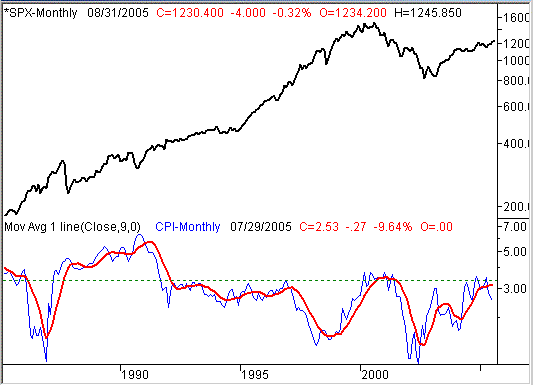
3) It's a bit pre-emptive, but definitely worth a closer look. Later today, we're going to hear July's consumer price index (or CPI) data. For those who don't know, this is the main barometer of inflation, stated in percentage terms. Of course, high inflation is bad for stocks, and low (or no) inflation is good for stocks, right? Well, no, not really. We went back several years looking for a correlation between inflation and the stock market. You know what? We can't find one. We've all been told that, as investors, we don't want inflation. Take a look at the chart below, and you might not worry about it nearly as much.
On the top part of the chart we plotted the S&P 500, going back all the way to 1980. On the bottom part of the chart, we've plotted the monthly CPI data (in blue). The red line is 12-month moving average of the data, which helps smooth the data out (not that it needs it - it's already annualized). The dashed line is the long-term historical average of the inflation percentage (as measured by change in the CPI data)....it's 3.28 percent. See if you see the problem.
S&P 500 versus Consumer Price Index - Monthly

Spot the hole in the theory? Inflation was through the roof and rising in the late 80's, yet stocks were roaring. On the flipside, inflation never got out of control in the late 90's and early 2000, yet stocks got hammered. In the interest of fair play, there were just as many instances where high inflation was in place at a market top, and low inflation was a problem at the onset of a few bear markets. The point is, there's no correlation.....or statistically, it's a random correlation. The media won't tell you that - it doesn't make for good TV (or good radio, or good news, or whatever). But, the charts don't lie. Unfortunately, too may folks have bought into the idea, but never asked for proof of the theory. The reality is visible in the chart above.
So are we saying inflation isn't a factor for stocks? Not at all. We're just saying that there are so many other factors in play (and in flux), you can't respond to this one piece of data. You can bet someone will though - just don't be a sheep who follows blindly.
The bottom line is this - most TV and other news is distracting for most investors, and highly detrimental for all traders. Turn the TV off. Be pro-active with what you see, and don't let the news dictate what you're 'supposed' to be worried about.
Price Headley is the founder and chief analyst of BigTrends.com.