| Corcoran Technical Trading Patterns for November 12 |
| By Clive Corcoran |
Published
11/12/2007
|
Stocks
|
Unrated
|
|
|
|
Corcoran Technical Trading Patterns for November 12
The Nasdaq 100 (^NDX) was last week’s big loser as the index dropped back by more than eight percent. Apple (AAPL) fell a rather stunning 12% during last week, Microsoft (MSFT) by more than 9% and even Google (GOOG), which for many fund managers can do no wrong, slid by almost seven percent. After a very difficult week the charts for many of the large tech stocks do look quite precarious and despite steep drops there could still be further to go on the downside as sentiment has clearly taken a battering.
Aggressively bearish trading desks now appear to be switching their focus away from scaring institutions out of the financial stocks, and are looking at what they now see as the easier prey of those long only fund managers who have been piling into the large tech stocks for months and who now appear to be running scared and liquidating positions.
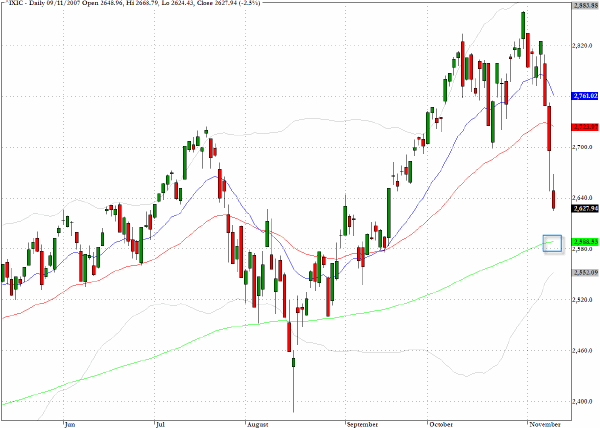
Looking at the chart for the Nasdaq Composite (^IXIC) a test of the 200-day EMA seems to be in the cards in the near term, and it is more than conceivable that we could see a testing of the mid-August low during trading this week.
The most perplexing issue during scanning the charts this weekend is the fact that while so many stocks look on the verge of possible avalanche action, including many of the previous high flying tech stocks and some of the large retailers, the sector action does not look uniformly bearish.
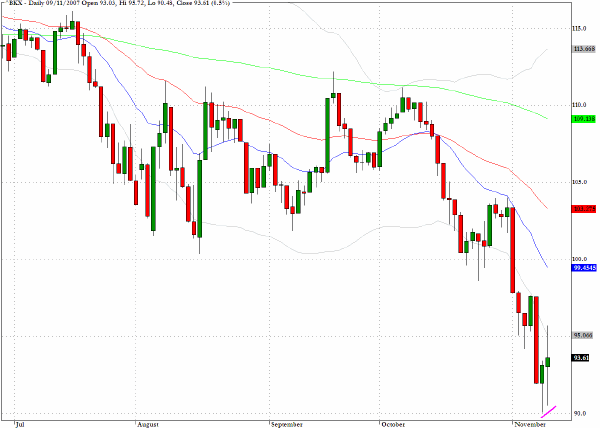
The banking index managed to record a small gain in Friday’s trading and as highlighted on the chart the intraday low was above that seen on Thursday. Although I would not be looking to establish long position trades in the banks, I suspect that there will be a bounce which could be surprisingly vigorous. Intraday trading in some of the banks and other financials could be very profitable, and the XLF sector fund is one way to play the inevitable short covering rallies that will arise.
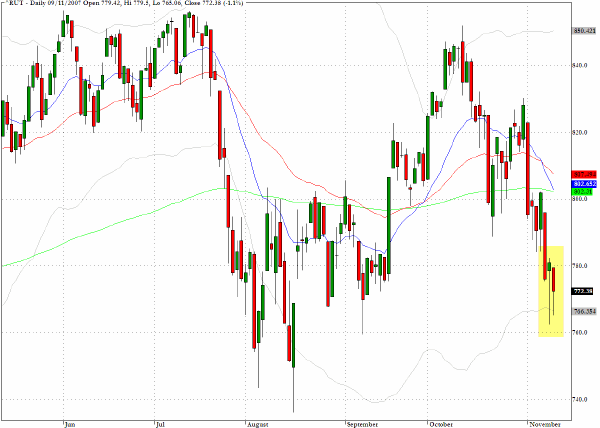
Another positive divergence from Friday’s session was the relatively “good” performance of the Russell 2000 (^RUT) which, in percentage terms, fell back by only one third of the loss seen on the Nasdaq 100. Over the course of last week the small cap index managed to confine its loss to just over three percent. If we are facing a market meltdown as some are proposing, then one would have expected to see more panic liquidations in the small cap sector than we did last week.
One of the key levels that I shall be watching this week is the 730-5 area on the Russell 2000 index (^RUT) which marked the mid-August low. If this is taken out the bears may see the big payday that they are increasingly betting on.
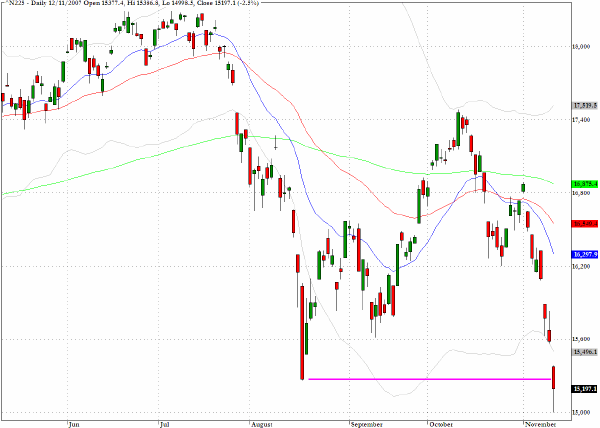
The Nikkei 225 (^N225) closed Monday’s trading below the mid-August low, underlining the fact that this index is acting more bearishly than any of the other major global equity indices.
TRADE OPPORTUNITIES/SETUPS FOR MONDAY NOVEMBER 12, 2007
The patterns identified below should be considered as indicative of eventual price direction in forthcoming trading sessions. None of these setups should be seen as specifically opportune for the current trading session.
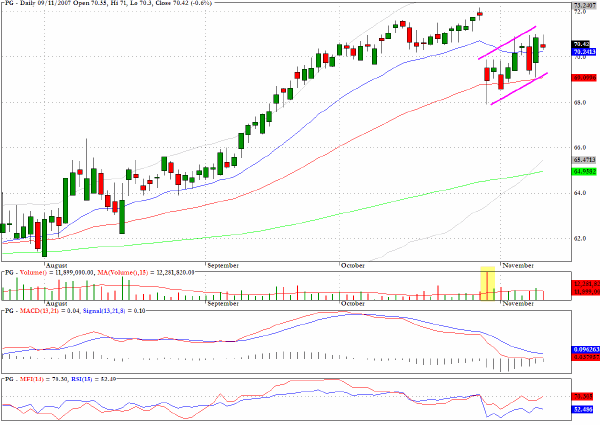
The chart for Procter & Gamble (PG) is pointing to a pullback channel following the recent gap down which may be close to having run its course.
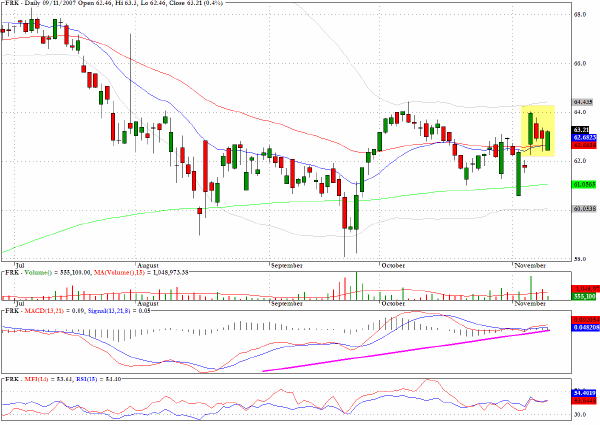
The chart for Florida Rock Industries (FRK) reveals a bullish flag as well as a positive-looking momentum pattern.
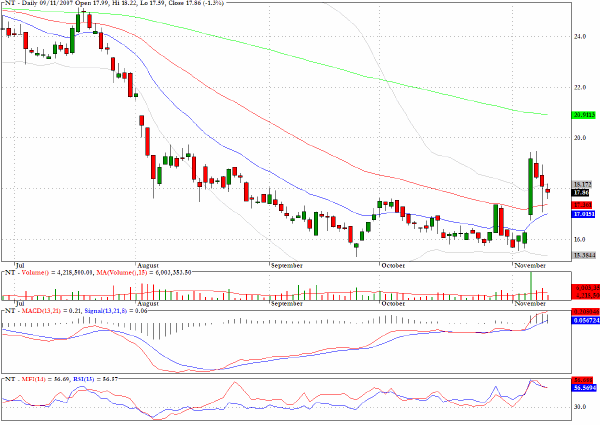
Nortel (NT) has been out of favor for so long that it appears to have discounted all the bad news, and the current pattern looks as though some recovery may be imminent.
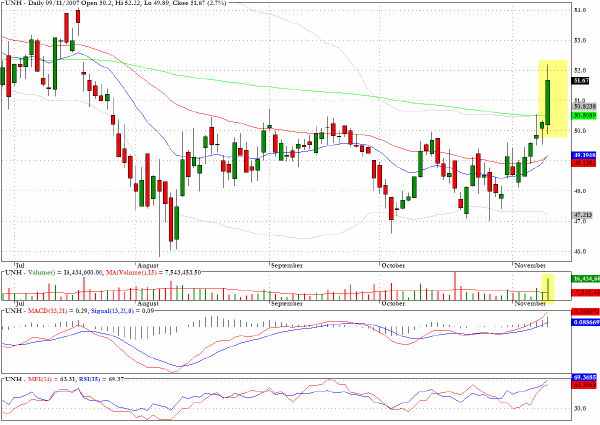
United Health Group (UNH) surged above the 200-day EMA on twice the average daily volume in Friday’s downbeat session.
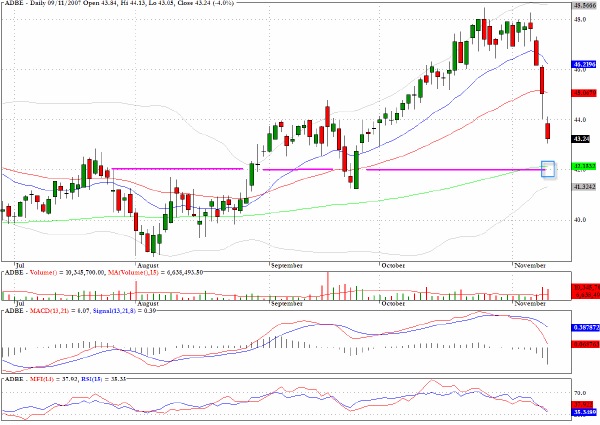
Adobe Systems (ADBE) has fallen quite hard in recent sessions, but the most plausible level of immediate support still lies below Friday’s closing price.
Clive Corcoran is the publisher of TradeWithForm.com, which provides daily analysis and commentary on the US stock market. He specializes in market neutral investing and and is currently working on a book about the benefits of trading with long/short strategies, which is scheduled for publication later this year.
Disclaimer
The purpose of this article is to offer you the chance to review the trading methodology, risk reduction strategies and portfolio construction techniques described at tradewithform.com. There is no guarantee that the trading strategies advocated will be profitable. Moreover, there is a risk that following these strategies will lead to loss of capital. Past results are no guarantee of future results. Trading stocks and CFD's can yield large rewards, but also has large potential risks. Trading with leverage can be especially risky. You should be fully aware of the risks of trading in the capital markets. You are strongly advised not to trade with capital.
|