| Weekly Outlook in the Stock Market |
| By Price Headley |
Published
11/12/2007
|
Stocks
|
Unrated
|
|
|
|
Weekly Outlook in the Stock Market
NASDAQ Composite
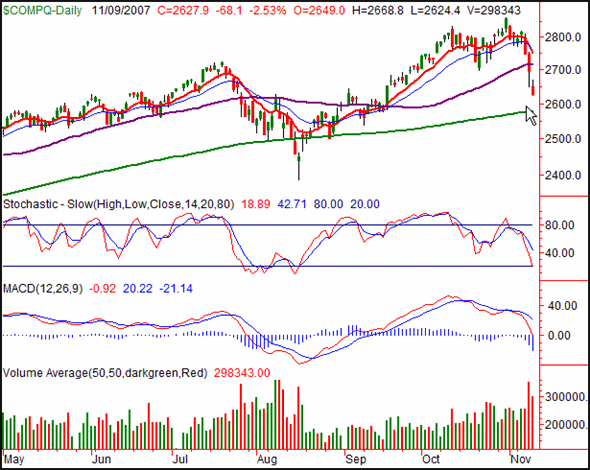
On Friday, the NASDAQ gave up a hefty 2.53% (-68.1 points) to close at 2627.9. That meant a 6.49% dip for the week and a loss of 182.5 points. That was the biggest single-week drop we've seen in a long time.
Monday is critical. On Thursday, it looked like we had a capitulation. The open was right at Wednesday's close, then we got a deep low, and then a rebound, forming a hammer shape not unlike the one we saw on August 16. The only difference was, the close was a bit weaker. But on Friday, the NASDAQ got whacked some more. So, it looks like Thursday wasn't the bottom.
On Friday, however, the NASDAQ did close at its low following a very still selloff (and on higher volume) - a much more subtle indicator that the bears may finally be exhausted. The thing is, we need some confirmation of that potential end of a downtrend and beginning of an uptrend; hence, that's why Monday is so critical.
In the bulls' favor, we're close to being stochastically oversold. But, we're not quite there yet, which means we may not be fully sold off yet. If there is more downside to go, we'll use the 200-day line (green) as the potential rebound point. It's at 2578 right now. As for bullishness, that's tougher. We may get a sharp rebound following last week's decimation. So, we'd only trust a rally if it was strong enough to carry the composite back above the 10/20 day averages at 2755.
NASDAQ Composite Chart - Daily

S&P 500
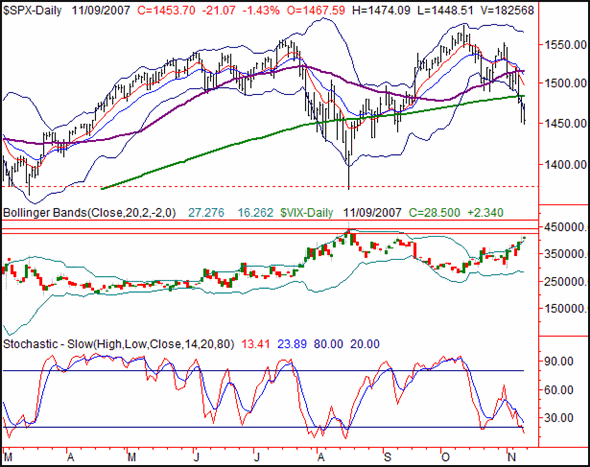
The S&P 500's close of 1453.7 on Friday was 21.07 points (-1.43%) under Thursday's close. It was also 55.95 points (-3.71%) under the prior Friday's close. Bad? Yes. A Bottom? Maybe, though we don't exactly have signs of that just yet. The bullish pump is primed, we'll say that much. The 200-day line (green) did NOT hold up as support. Then again, it didn't hold up as support in August either, but wasn't disastrous for the index; it bounced quite well a few days later.
The bullishness we mentioned shows up in two places on our chart. The first is on the VIX. As of Friday, it looks like the VIX is trending higher. However, it's also approaching levels where it rolled over in August. All three of those are marked with red horizontal lines. The other bullish scenario is evident on the stochastics chart. We're a hair away from being officially oversold.
The thing about both of those hints is that neither really say with any precision exactly when the reversal will be made. We could stay oversold for a while. And the VIX could inch its way into those resistance lines without ever really rolling over. We'll need to see true bullish patterns emerge from both tools to get too excited.
In the meantime, the trend remains to the downside. The SPX is pressing into the lower Bollinger band (relentlessly), and the momentum is clear. Speaking of, here's a good time for a reality check. See the red dashed line? That's where the SPX found support in August, and even April. The October peak wasn't that much higher than July's peak before the index tumbled all the way back to that line near 1370. So, don't rule out the possibility of a dip of that magnitude again. Don't be fooled by a little intra-day or end-of-day bullishness. Only a move back above the 50-day line (purple) at 1515 would heal all this damage.
S&P 500 Chart - Daily

Dow Jones Industrial Average
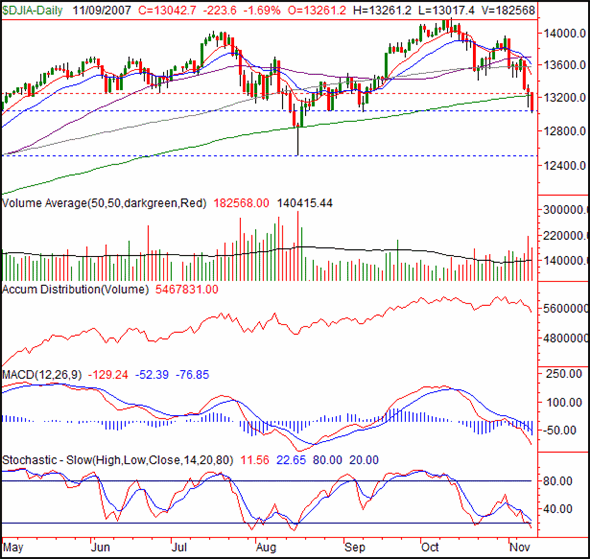
The Dow Jones Industrials lost 223.6 points on Friday, or 1.69%. On a weekly basis, the blue-chip average fell 4.06%, or 552.4 points. The Dow's chart has a lot of parallels with the S&P 500's right now, so no need to hash out the same details again. We'll just mention that the Dow is also under the 200-day line (green), and is right at September's low (the upper blue, dashed line). Should that line fail as support on Monday - or after Monday - then the next support line is August's low of 12,518.
Momentum? Bearish. Volume? Bearish. Stochastics? Bearish for now, but with huge potential (now) for bullishness.
Dow Jones Industrial Average Chart - Daily

Price Headley is the founder and chief analyst of BigTrends.com.
|