| Corcoran Technical Trading Patterns for November 15 |
| By Clive Corcoran |
Published
11/15/2007
|
Stocks
|
Unrated
|
|
|
|
Corcoran Technical Trading Patterns for November 15
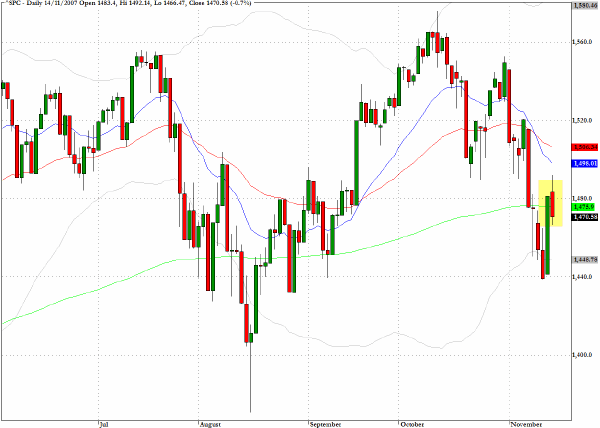
Equity markets failed to follow through after Tuesday’s strong rally, and the S&P 500 (^SPC) fell back below the 200-day EMA. Moreover, the volume on the SPY proxy was notably higher than that achieved in Tuesday’s almost 3% rally. This lends supporting evidence to the view that much of what was seen on Tuesday was short covering by hedge funds and trading desks rather than new institutional buying.
One of the more surprising developments yesterday was the bearish comments from the Governor of the Bank of England that global share prices were out of alignment with deteriorating economic and financial conditions. Central bankers usually do not express such honest views about the state of the equity markets and one of the consequences of his downbeat assessment, that was especially targeted at the UK economy, was a slide of the pound sterling especially against the euro. This cross rate could have further to slide and the rate of sterling against the dollar may also be topping out.
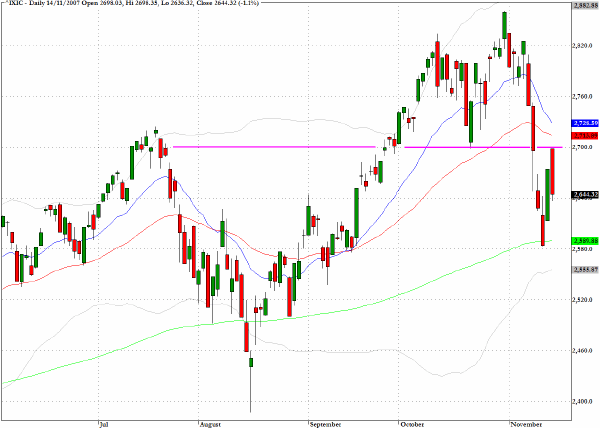
The Nasdaq Composite (^IXIC) gave back almost one third of Tuesday’s gains and the index still faces the resistance of the 50-day EMA.
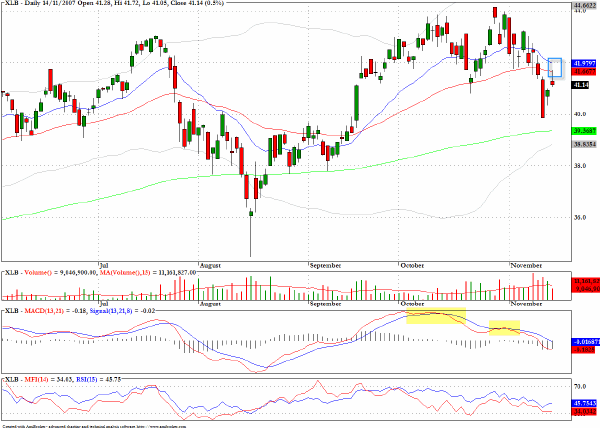
The sector fund for raw materials, XLB, is displaying some negative divergences and the performance of some of the industrial materials stocks as well as the shipping stocks suggests that fund managers are starting to take the possibility of a global economic slowdown more seriously.
TRADE OPPORTUNITIES/SETUPS FOR THURSDAY NOVEMBER 15, 2007
The patterns identified below should be considered as indicative of eventual price direction in forthcoming trading sessions. None of these setups should be seen as specifically opportune for the current trading session.
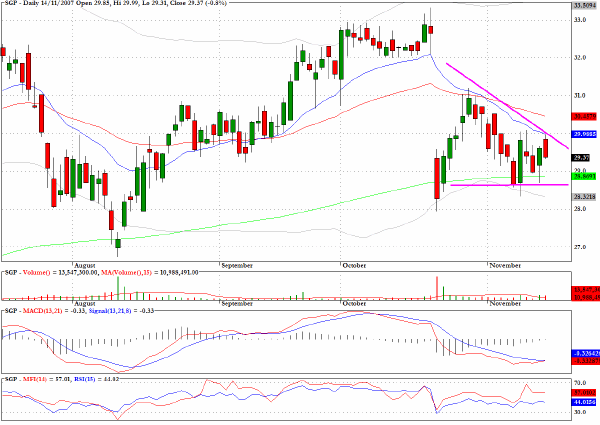
Schering Plough (SGP) appears to be in the midst of forming a bearish descending wedge pattern.
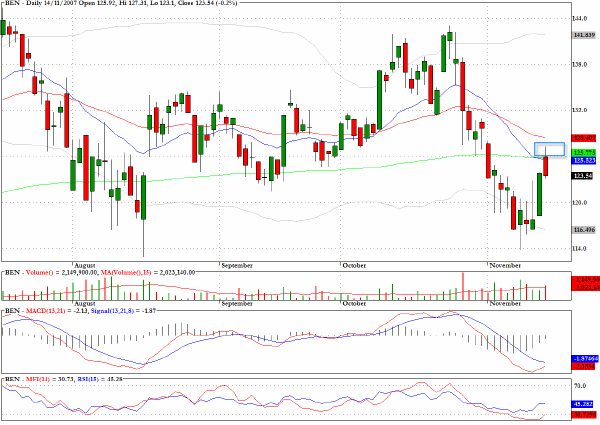
Asset management company Franklin Resources (BEN) faces quite a strong hurdle as all three moving averages lie just above yesterday’s close.
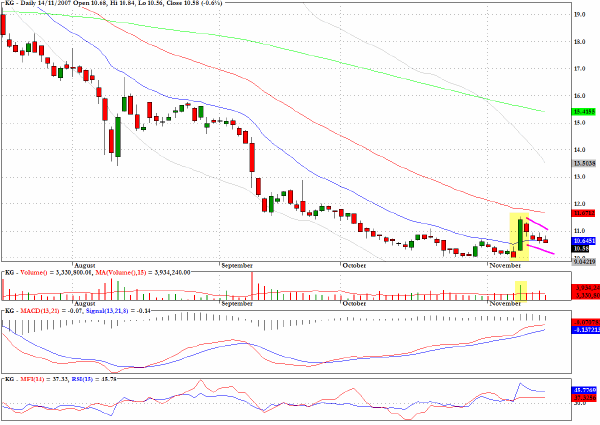
The chart for King Pharmaceuticals (KG) reveals a bullish flag pattern.
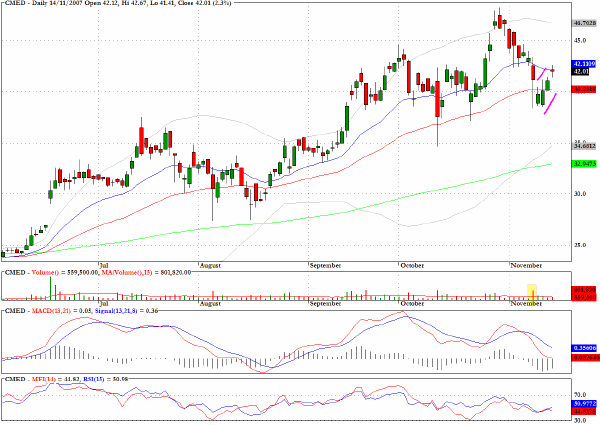
China Medical Technologies (CMED) could struggle to make much further upward progress following the high volume sell off on November 8.
Clive Corcoran is the publisher of TradeWithForm.com, which provides daily analysis and commentary on the US stock market. He specializes in market neutral investing and and is currently working on a book about the benefits of trading with long/short strategies, which is scheduled for publication later this year.
Disclaimer
The purpose of this article is to offer you the chance to review the trading methodology, risk reduction strategies and portfolio construction techniques described at tradewithform.com. There is no guarantee that the trading strategies advocated will be profitable. Moreover, there is a risk that following these strategies will lead to loss of capital. Past results are no guarantee of future results. Trading stocks and CFD's can yield large rewards, but also has large potential risks. Trading with leverage can be especially risky. You should be fully aware of the risks of trading in the capital markets. You are strongly advised not to trade with capital.
|