| A Mid-Week Look at the Market |
| By Price Headley |
Published
11/16/2007
|
Stocks
|
Unrated
|
|
|
|
A Mid-Week Look at the Market
NASDAQ Composite Commentary
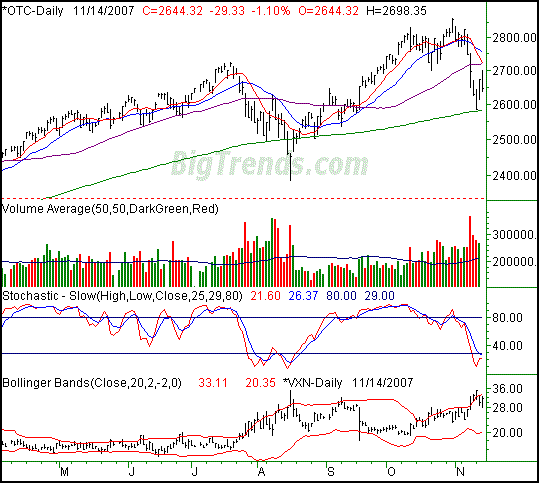
Down 29.33 points (-1.10%) on Wednesday the NASDAQ closed at 2644.32. For the week, it's still up 0.62%, or 16.38 points above last week's closing level. Despite Wednesday, this chart actually offers the most hope to the bulls.
The green line is the 200-day line. Clearly the NASDAQ used it as a floor on Monday, which ultimately became a rally point on Tuesday. Score one for the bulls. Things looked even better on Wednesday for a while, but we ended up in the red. Score one for the bears.
So what's the score? At this point we'd call it a tie game. The NASDAQ is resting between that 200-day average as well as every other key moving average line. The one thing the bulls have going for them is that the NASDAQ is officially oversold stochastically. But, we're not at a rebound point yet, at least not a confirmed one.
NASDAQ Composite Chart - Daily

S&P 500 Commentary
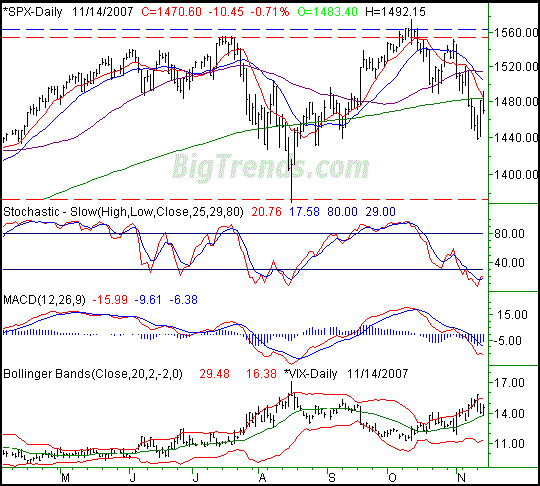
The S&P 500's 10.45 point loss on Friday left it at 1470.60, a 0.71% loss. For the week though, it's still up by 1.16%, or 16.90 points. The problem is, Wednesday's reversal couldn't have come at a more inopportune time, if you're a bull, maybe.
The concern is the resistance we met on Wednesday. The 200-day line (green) as well as the 10-day line (red) both sent the index lower shortly after they were met again. Of course, that didn't mean much in August, at least not for very long. Being stochastically oversold here as well does leave the index ripe for a rebound.
The challenge is the VIX. Is it bullish or bearish? The day-to-day ranges are actually bullish for stocks, in that they're falling. However, we're seeing closes at the higher end of the daily range. More than that, the 20-day average line (green) for the VIX has thus far been support, particularly on Wednesday. We'll have to wait to see how this shakes out over the rest of this expiration week.
S&P 500 Chart - Daily

Dow Jones Industrial Average Commentary
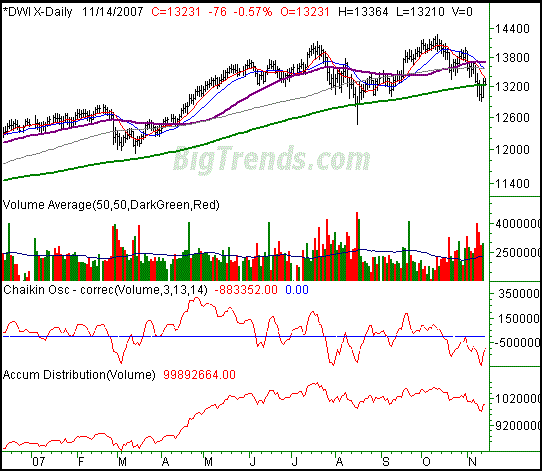
The Dow sank 76 points (-0.57%) on Wednesday, ending the session at 13,231. On a weekly basis, that whittles the gain back down to only a 188 point/1.44% gain above Friday's close. The dance with the 200-day average line is getting a little too comfortable for our comfort.
As a matter of fact, this is the most time we've spent under the 200-day line on months - not a good sign. More than that, the 10-day line was verified as resistance on Wednesday. Plus, all measures of volume trend (Chaikin and accumulation-distribution) are showing the same bearish concern; the strength has been whittled away.
Yet, this is about as far as the Dow is accustomed to falling under the 200-day average. You have to go back to 2005 to find dips bigger than this one.
Dow Jones Industrial Average Chart - Daily

Price Headley is the founder and chief analyst of BigTrends.com.
|