| The McMillan Options Strategist Weekly |
| By Lawrence G. McMillan |
Published
11/16/2007
|
Options
|
Unrated
|
|
|
|
The McMillan Options Strategist Weekly
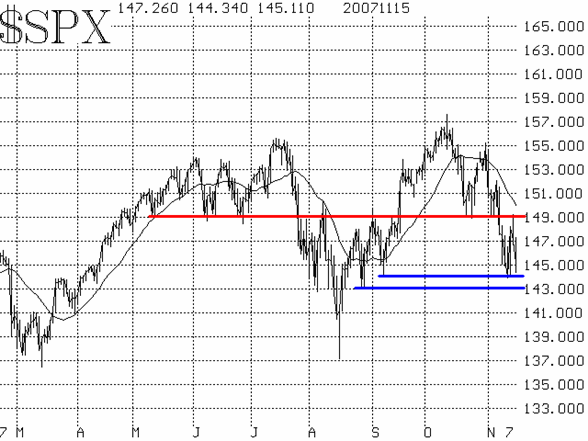
This week's action in the stock market has been quite illustrative. The huge rally that occurred on Tuesday has been shown to be nothing more than a one-day wonder, merely a sharp, but short-lived (albeit large) rally in response to an oversold condition. That rally peaked on Wednesday morning at the $SPX resistance point of 1490. We had already identified that level as potential resistance, and now it has been confirmed once again. Until further notice, any $SPX rallies towards that level can be viewed as opportunities to buy puts or establish other bearish positions.
Besides the resistance at 1490, the $SPX chart shows support at the 1430-1440 area (the week's low was at 1440). If that level gives way, it is likely that the August lows near 1370 would be tested.

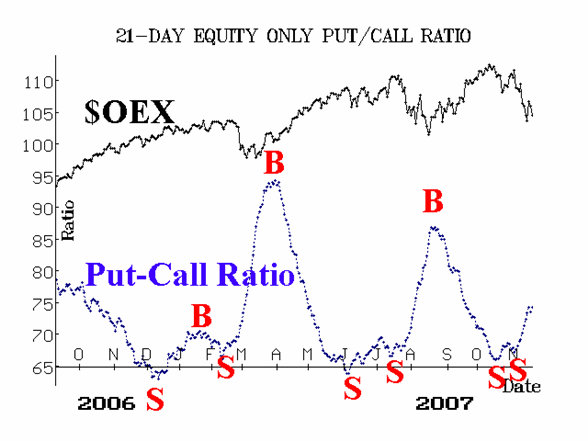
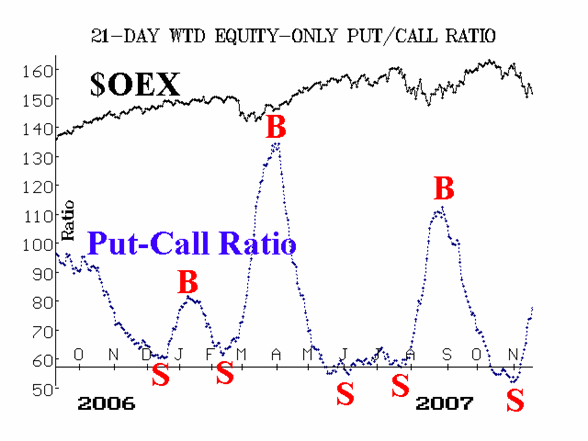
The equity-only put-call ratios are still bearish, as they continue to rise on their charts. They didn't even budge during the huge Tuesday rally. That's not particularly surprising since they are 21-day ratios, but even more important: there was fairly heavy put volume during that rally. These ratios will remain bearish until they roll over and begin to decline, an event that doesn't seem likely in the near term.

Market breadth has been negative for some time now. That was part of the foundation for the sharp rally on Tuesday. However, even that large rally merely served to alleviate the oversold condition. Breadth remains on sell signals; the oversold conditions may pave the way for sharp, but short-lived rallies. But oversold conditions are not true buy signals of a lasting nature.

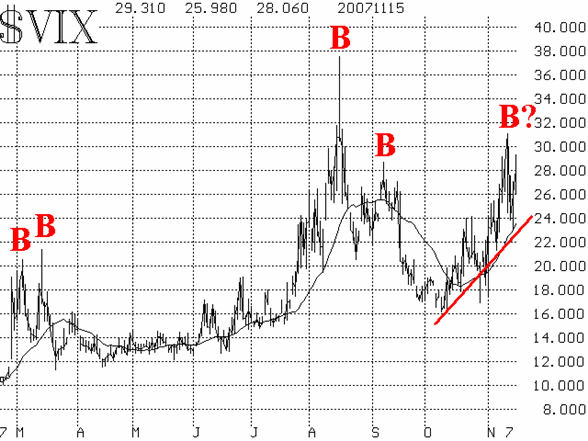
Volatility indices ($VIX and $VXO) seemingly gave buy signals when they fell sharply on Tuesday. $VIX dropped 7 points that day (a single-day record drop). Normally that would constitute a spike peak buy signal, one that is typically an intermediate-term buy.Countering that, though, is the fact that the trend of $VIX remains upward (see the 20-day moving average in Figure 4). Thus, we would want to see $VIX close below its 20-day moving average (currently above 24) before declaring that Monday's spike in $VIX was actually a buy signal.

Overall, though, the picture is negative. Rallies can be sold, especially ones that extend up towards the $SPX 1490 level. It remains to be seen where support will arise. So far it has been at a level that would indicate a volatile trading range environment, but a break below support would be a much more bearish development.
Lawrence G. McMillan is the author of two best selling books on options, including Options as a Strategic Investment, recognized as essential resources for any serious option trader's library.
|