| Corcoran Technical Trading Patterns for November 16 |
| By Clive Corcoran |
Published
11/16/2007
|
Stocks
|
Unrated
|
|
|
|
Corcoran Technical Trading Patterns for November 16
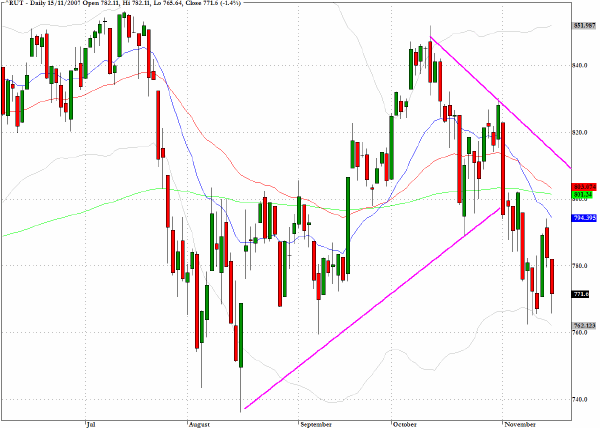
The question that I would expect to linger beyond today’s session is whether the markets are simply performing a re-test of last Thursday’s low or are gearing up for a new substantial leg down. As always I will be monitoring the price action on the Russell 2000 index (^RUT) which, as far as the pattern following yesterday’s trading is concerned, leaves us guessing as to the possible near-term direction. The pattern still could be seen as one of slightly higher intraday lows that may suggest that a retest may already have been made, but stepping back to review the bigger picture the chart pattern looks troublesome for the bulls.
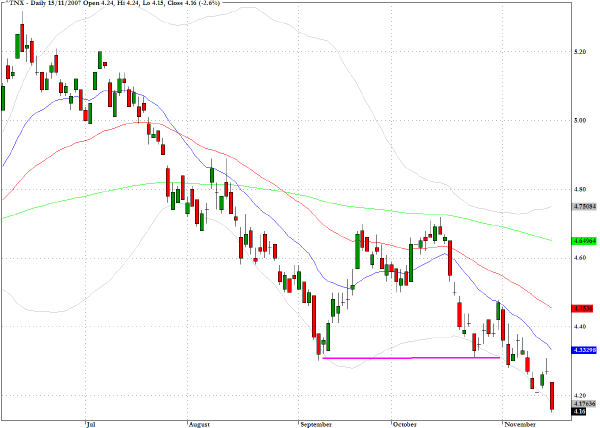
Yields on treasury notes are continuing to move lower and the floor around 4.4% has been decidedly broken, and we should now expect further moves down to the next potential floor at 4%. There is no doubt that many traders are now becoming convinced about the likelihood of a serious slowing of economic vitality in the global economy.
On this theme, yesterday’s discussion about the weakness in the industrial materials sector and the vulnerability of the sector fund XLB proved to be timely as the fund dropped down by 2.2% on substantially increased volume.
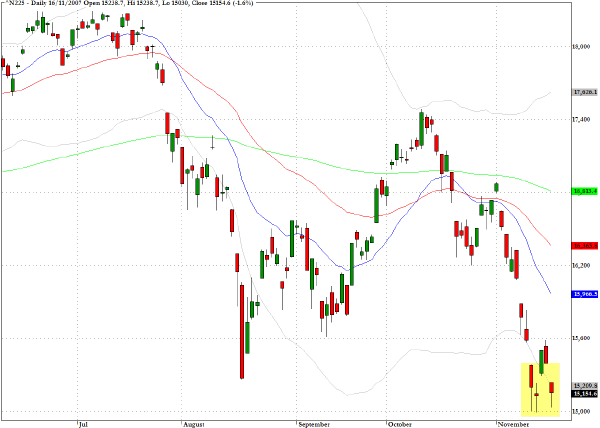
More evidence to keep us guessing about the retest of recent lows is to be found on the Nikkei 225 index (^N225) which closed Friday’s session just above Tuesday’s low and there is at least the suggestion of slightly higher intraday lows. Having said that, the pattern looks as though traders are waiting for further cues from action in the US today, and it must be said that the overall formation hardly looks inspiring for the bullish case.
TRADE OPPORTUNITIES/SETUPS FOR FRIDAY NOVEMBER 16, 2007
The patterns identified below should be considered as indicative of eventual price direction in forthcoming trading sessions. None of these setups should be seen as specifically opportune for the current trading session.
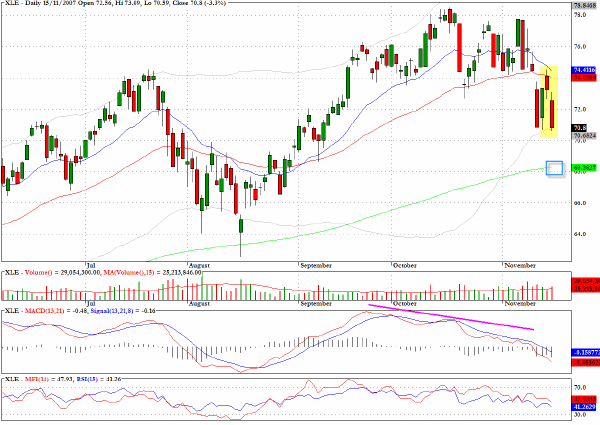
The energy sector fund, XLE, reveals very noticeable negative divergences in momentum and the 200-day EMA seems like a probable intermediate term target.
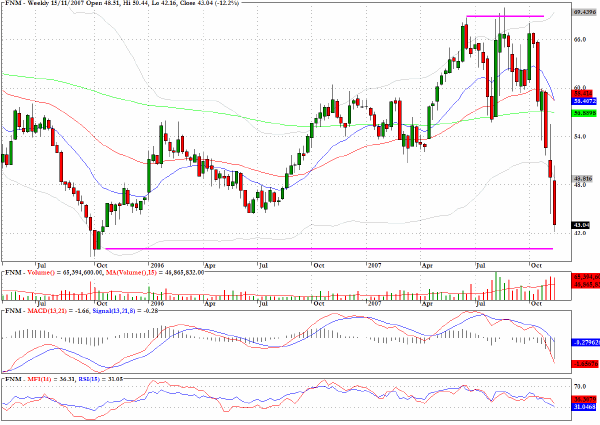
The weekly chart for Fannie Mae (FNM) shows that after yesterday’s ten percent fall there will need to be a test of the October, 2005 low.
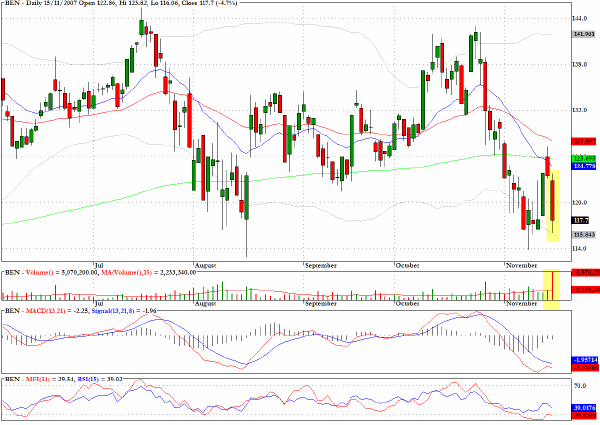
We noted yesterday that asset management company Franklin Resources (BEN) faced a strong hurdle at the convergence of all three moving averages. The stock sold off by almost five percent on twice the average daily volume and may need to probe for meaningful support at lower price levels.
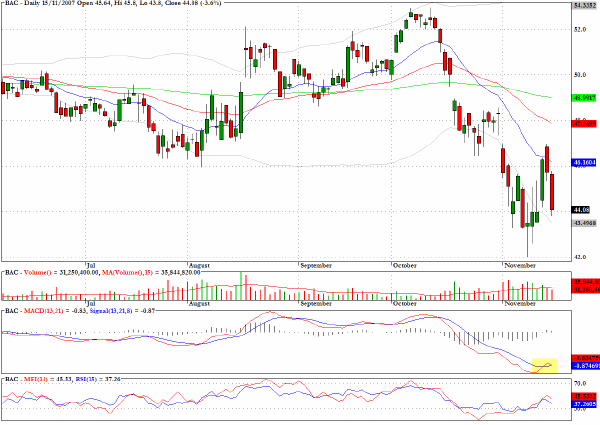
Returning to the theme of whether the most recent price action is just the market going through the motions of a re-test of last week’s low or something more serious, the chart for Bank of America (BAC) could be offering a more encouraging reading for the bulls.
Clive Corcoran is the publisher of TradeWithForm.com, which provides daily analysis and commentary on the US stock market. He specializes in market neutral investing and and is currently working on a book about the benefits of trading with long/short strategies, which is scheduled for publication later this year.
Disclaimer
The purpose of this article is to offer you the chance to review the trading methodology, risk reduction strategies and portfolio construction techniques described at tradewithform.com. There is no guarantee that the trading strategies advocated will be profitable. Moreover, there is a risk that following these strategies will lead to loss of capital. Past results are no guarantee of future results. Trading stocks and CFD's can yield large rewards, but also has large potential risks. Trading with leverage can be especially risky. You should be fully aware of the risks of trading in the capital markets. You are strongly advised not to trade with capital.
|