| Corcoran Technical Trading Patterns for November 19 |
| By Clive Corcoran |
Published
11/19/2007
|
Stocks
|
Unrated
|
|
|
|
Corcoran Technical Trading Patterns for November 19
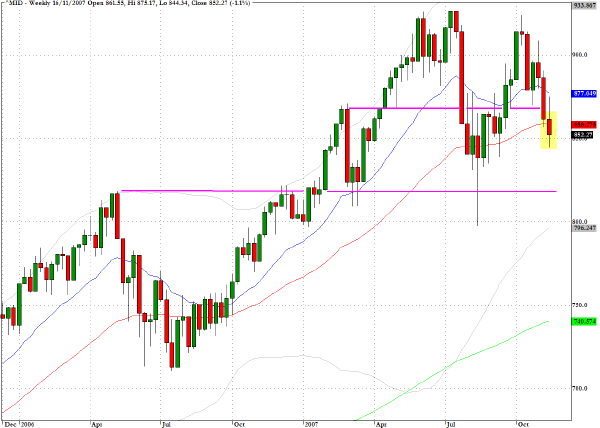
The weekly chart for the S&P 400 Midcap index (^MID) highlights the gray area currently occupied by many of the market’s typical and less discussed stocks. These are also the securities that are unlikely to feature prominently in daily gyrations created by omnipresent long/short trading strategies.
In harmony also with the Russell 1000 (^RUI), the midcap index has entered a transition zone between the two pivotal lines that have been drawn on the chart below.
The index has broken below the 50-week EMA and the 870 level which marked the April, 2007 breakout level. After the August sell-off the index made a valiant effort to reach back towards new highs but failed before regaining the 926 level setting up the rather ominous lower high in early October. The index now sits at a fairly critical level where, if there is a concerted effort by fund managers and trading desks to push the market higher as we move into the "holiday" season, the market internals could entice panic buying as fund managers do not want to miss out on a year end rally.
With news flow running very negatively and many proprietary trading desks positioned to make money on the short side we cannot rule out a strong contrarian move that could, at least temporarily, revive enthusiasm for putting money to work on the long side. If, however, the Midcap index breaks below the 820 level, which is the lower line on the chart and represents the early 2007 push above previous chart resistance, this would act as a clear indication, for me at least, that the positive momentum that has propelled the bull market since 2003 has been fully spent.
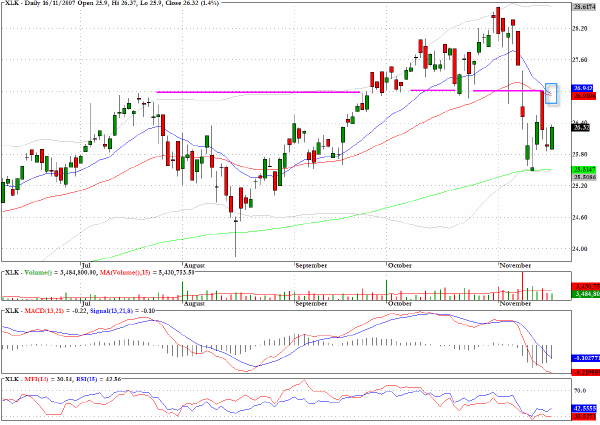
If the most ardent of the bulls who maintain that we will see new highs on the major indices before the end of this year are to be taken seriously, we would have to see a re-assertion of the leadership from the large tech stocks. To remove my doubts about this proposition the sector fund, XLK, which is comprised of some of the most notable technology companies would have to move above the $27 level which coincides with the price breakout which propelled the sector in late September above the preceding high in July.
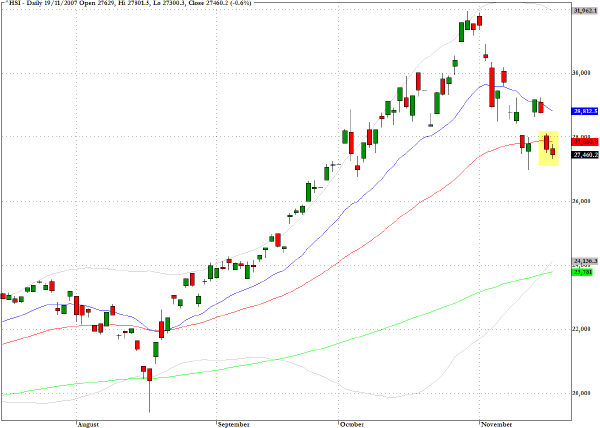
The Hang Seng index (^HSI) has now registered three closes below the 50-day EMA and at its lowest level in six weeks. The conclusion of trading in Monday’s session saw a further modest loss of 0.6% but the intraday low managed to remain above that seen in last Tuesday’s session. The index is hanging on by its fingertips and I would suggest that despite all of the talk about "de-coupling", the large funds, that are very flush with Asian equities at present, are watching the US equity market very carefully for directional cues.
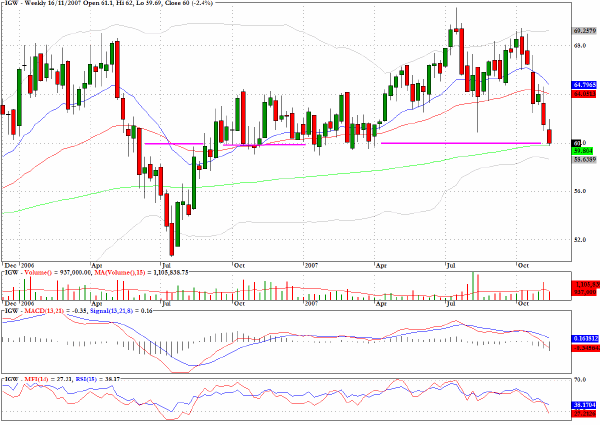
In addition to the XLK fund I would suggest that the semiconductors have reached a level where they should show some signs of recovery if fund managers still see merit in the sector and want to take advantage of a retreat to a value area that revealed itself throughout the earlier part of this year.
TRADE OPPORTUNITIES/SETUPS FOR MONDAY NOVEMBER 19, 2007
The patterns identified below should be considered as indicative of eventual price direction in forthcoming trading sessions. None of these setups should be seen as specifically opportune for the current trading session.
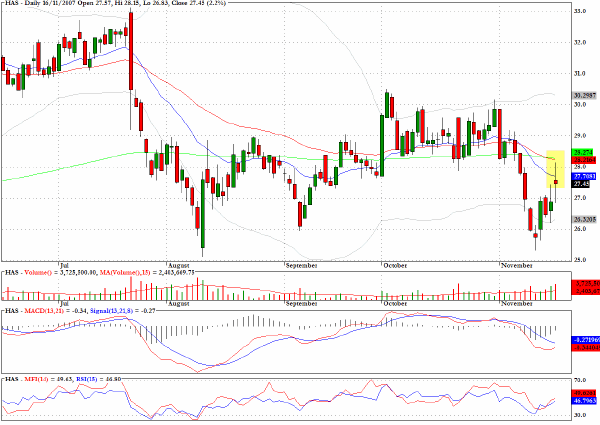
Hasbro (HAS) is close to an area of strong overhead resistance.
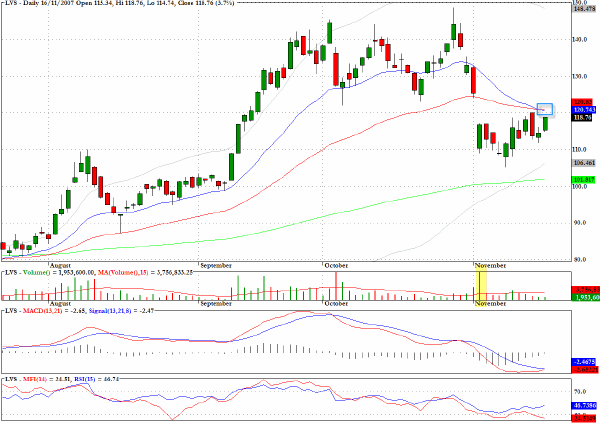
Las Vegas Sands (LVS) slumped in early November on very heavy volume and is about to encounter overhead resistance from two key moving averages.
Clive Corcoran is the publisher of TradeWithForm.com, which provides daily analysis and commentary on the US stock market. He specializes in market neutral investing and and is currently working on a book about the benefits of trading with long/short strategies, which is scheduled for publication later this year.
Disclaimer
The purpose of this article is to offer you the chance to review the trading methodology, risk reduction strategies and portfolio construction techniques described at tradewithform.com. There is no guarantee that the trading strategies advocated will be profitable. Moreover, there is a risk that following these strategies will lead to loss of capital. Past results are no guarantee of future results. Trading stocks and CFD's can yield large rewards, but also has large potential risks. Trading with leverage can be especially risky. You should be fully aware of the risks of trading in the capital markets. You are strongly advised not to trade with capital.
|