|
Weekly Outlook in the Stock Market
NASDAQ Composite
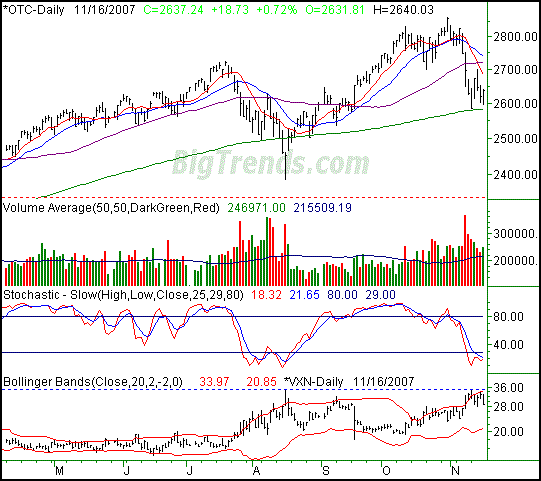
The NASDAQ Composite made its way up to 2637.24 on Friday, up 18.73 points, or 0.72%. That was 9.3 points higher than last week's close, or +0.35%. Not only was the net change basically nil, the ceiling and floor for the trading range are tightening pretty fast. Something's got to give soon, though the shortened trading week we're in right now isn't likely to be volatile enough to make it happen by Friday.
Most of our analysis is on the S&P 500 and the Dow today, but we do want to point out that - so far - the NASDAQ's 200-day line (green) has continued to act as support. It's the only index that statement can be said about.
On the flipside, the VXN is back up to levels at which it stalled and then fell in August (blue, dashed line), sending stock higher as a result. In fact, it looks as of the VXN already hit a ceiling back on August 12, and has just drifted lower since then. We're oversold too, so the stage is set. But, will it mean anything? Not yet. There's not enough evidence that we're interested in a rebound just yet.
NASDAQ Composite Chart - Daily

S&P 500
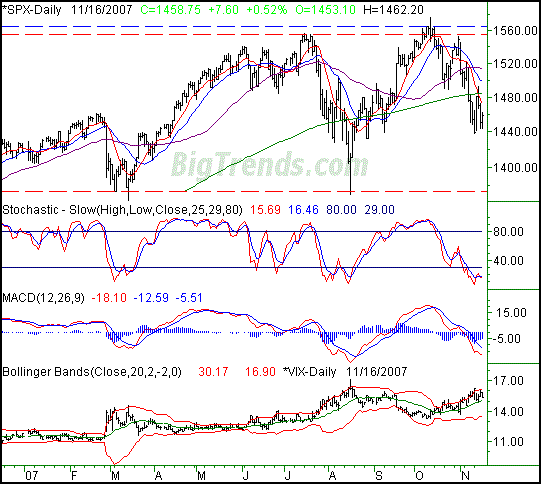
Up 7.6 points on Friday (+0.52%), the S&P 500 ended the session at 1458.75. That was 5.05 points better than last Friday's close, or +0.35%. Despite the 'up' week, the SPX is still blatantly under all of its key moving averages, not a good sign.
Nevertheless, the SPX's chart remains a riddle. Momentum is bearish, with the index itself now under all of its key average lines, not to mention a bearish MACD cross still well in effect. On the bullish side of the equation, we're clearly oversold (stochastically) now, which traders haven't allowed to persist for very long over the least several months.
In that light, we'll remind you once again a revisit to the support line at 1372 (red, dashed, the lower one) still isn't out of the question, though it would be a hearty blow.
We remain partially fixated on the VIX, expecting it to signal a true bottom with a tall spike of its own. We've seen the VIX drift higher (in general), but have yet to see a blow-out day for stocks - nor a surge for the VIX - that really drives things to a bottom. The exception might be when and if the VIX slides back under its 20-day moving average line at 23.80. It might take a couple of days to really see for sure that it's happening, but with the distance between there and the lower band line at 16.62, that's a lot of room and time for stocks to rally (especially now that we're in the bullish season).
All of that, however, is conditional. We have to assume more downside until the streak can be broken.
S&P 500 Chart - Daily

Dow Jones Industrial Average
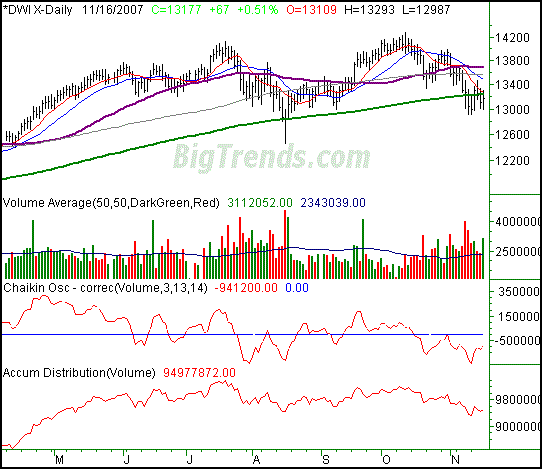
The Dow Jones Industrials gained 67 points on Friday, or 0.51%, closing out at 13,177. On a weekly basis, that meant a 134 point/+1.03% gain. It was also another close under the 200-day average, which we've seen more than a few of over the last seven trading days.
As it strands right now, the 10-day moving average line (red) is acting as the key ceiling, and it's just a hair away from falling under the 200-day line (green) for the first time since July of 2006. If that rings a bell, it's because the recovery started a few days before that.
Will we repeat that rebound, being in the same basic oversold condition? We're not banking on it. That's not to say we won't or can't climb out of this rut, but it's not the same time of year, and there's no reason why now should be comparable to then. No, we have to take this gradually-weakening status at face value, and be bearish until it's clear we can't be. That means at least a cross back above the 10-day line at 13,262. And really, we need to hurdle the 50-day line (purple) again at 13,678.
The challenge has been volume; it's more bearish than bullish, and has been for a while (though Friday was an exception). We'll look to the Chaikin line as a sign of renewed bullishness. Specifically, we'll want to see it get back above its own zero level before getting too optimistic.
Dow Jones Industrial Average Chart - Daily

Price Headley is the founder and chief analyst of BigTrends.com.
|