NASDAQ COMMENTARY
After yesterday's 30 point plunge, it's not totally surprising to see a little relief today. The question is, will there be even more buying later in the day, or will these bulls yield to the sellers again. We think the latter.
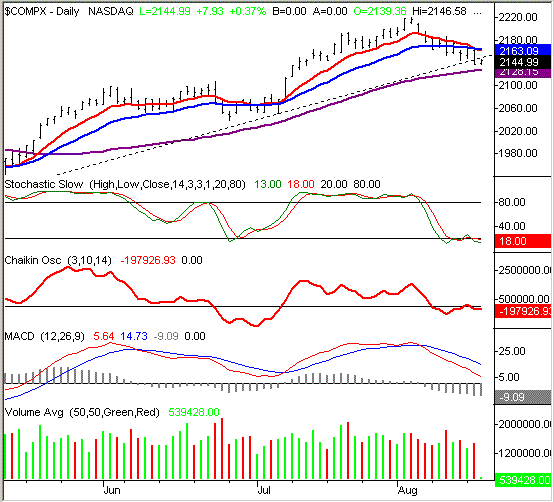
For the first time in months, the NASDAQ's 10 day line is under the 20 day moving average. We had a brush with this possibility in mid-June, but it never came to fruition. The last couple of weeks, though, have been rough enough to complete the crossunder this time. The implication is simple - the short-term momentum is bearish. And now that we've seen the composite cross under the 10 day average (red), it's become a resistance line. In fact, the 20 day line (blue) has too. The 10 day line is currently at 2162. Even with the index trading at 2145, that's still well under the 10 day average. We'll set our resistance level there at the 10 day mark. Keep in mind that leaves room for 17 more points of gain before resistance is met. In other words, the NASDAQ could climb for a couple more sessions, and we'd still be bearish.
As for support, there were two lines, until yesterday. The straight-line support (dashed) at 2145 was broken yesterday. The 50 day line, though, still stands. It's at 2128......that's 17 points under the NASDAQ's current level. Given the strength of this downtrend, we have to question whether the 50 day line will even be able to hold up if it gets tested.
Aside from the momentum, we're now in the bearish camp based on volume. Take a look at the last six days (not counting today). Each green bar (a bullish volume day) was topped the very next day with even more bearish volume......it happened all three bullish days.
NASDAQ CHART - Daily

S&P 500 COMMENTARY
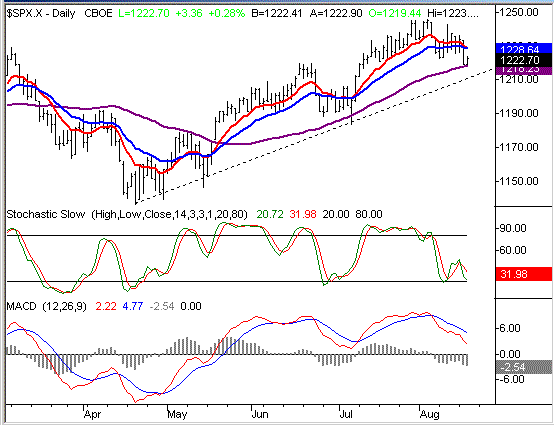
The S&P 500 is up as well, after Tuesday's 14.5 point whack. Today's high point (so far) is only about four points above Tuesday's close of 1219.34, so the 'buying on the dip' has probably disappointed a few bulls. In fact, the modest buy-in today may be a little exaggerated. The 50 day line (purple) proved to be support yesterday, with the SPX closing right above it. Today's low (1218.07) was also right at the 50 day line. So, the strength may be more technical based than genuine bullishness. On the other hand, the 50 day average has been meaningful for the S&P 500 in its recent history, both as support and resistance. This will be the key level to watch here.
But as with the NASDAQ, we have to assume that, since we're now at one-month lows (and under the short-term averages) the bears are in the driver's seat. That may not appear to be the case today, or even tomorrow. Let's wait and see what happens when we finally retest the 10 day moving average line though. Like the NASDAQ, the S&P's 10 day line has fallen under the 20 day average for the first time in a long time - a bearish omen.
The S&P has yet to fall under its straight-line support (dashed). It's at 1211 and rising sharply, so be sure to keep an eye on that one in addition to the 50 day average.
S&P 500 CHART - DAILY

DOW JONES INDUSTRIAL AVERAGE COMMENTARY
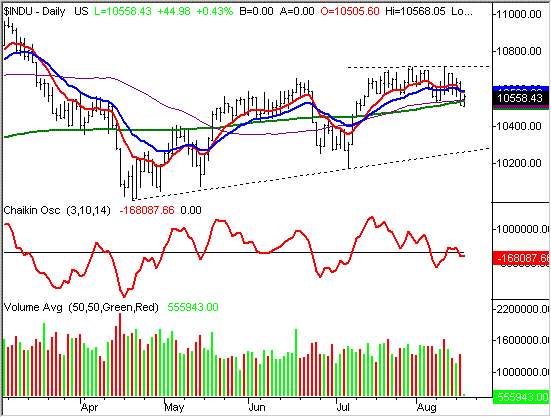
The Dow seems to be the most troubled of the three major indexes. Not only did it close under its 50 day average (purple) yesterday, it also closed under its 200 day line. Yes, it's up by the greatest percentage today, but that doesn't change the fact that a very important moving average failed to act as support. We even made a lower low today, before moving on to positive territory.
Is today's cross back above these averages a bullish sign that the 50 and 200 day averages represent good 'values' for investors? Anything's possible, but we attribute this gain just to the choppiness that usually accompanies the cross of a big milestone.....especially a bearish one. Obviously some folks are fighting the downtrend, but with as much technical damage that's been done here in the last two weeks, we think those folks are fighting a losing battle.
For the sake of continuity, we'll plot the Dow's straight-line support too (dashed). It's currently at 10,260, which seems miles away from the Dow's current level of 10,558. But, it's only about 3 percent away. That's not an unusual sized dip (see June's).
DOW JONES INDUSTRIAL AVERAGE CHART - DAILY

BOTTOM LINE
Don't forget that's it's an expiration week. That typically can keep markets volatile, but rarely leads to any significant net change. This will be particularly important to remember if we get a couple of highly bullish days before Friday, since it still won't change the downtrend we've developed over the last few trading session. the 10 and 20 day lines are the lines to keep an eye on. A couple of closes above them will negate our bearish stance here, but we don't expect to see that for a while.
Price Headley is the founder and chief analyst of BigTrends.com.